All work

Skyline Robotics

Fleet Monitoring Platform

B2B SaaS platform for robotic window-cleaning operations

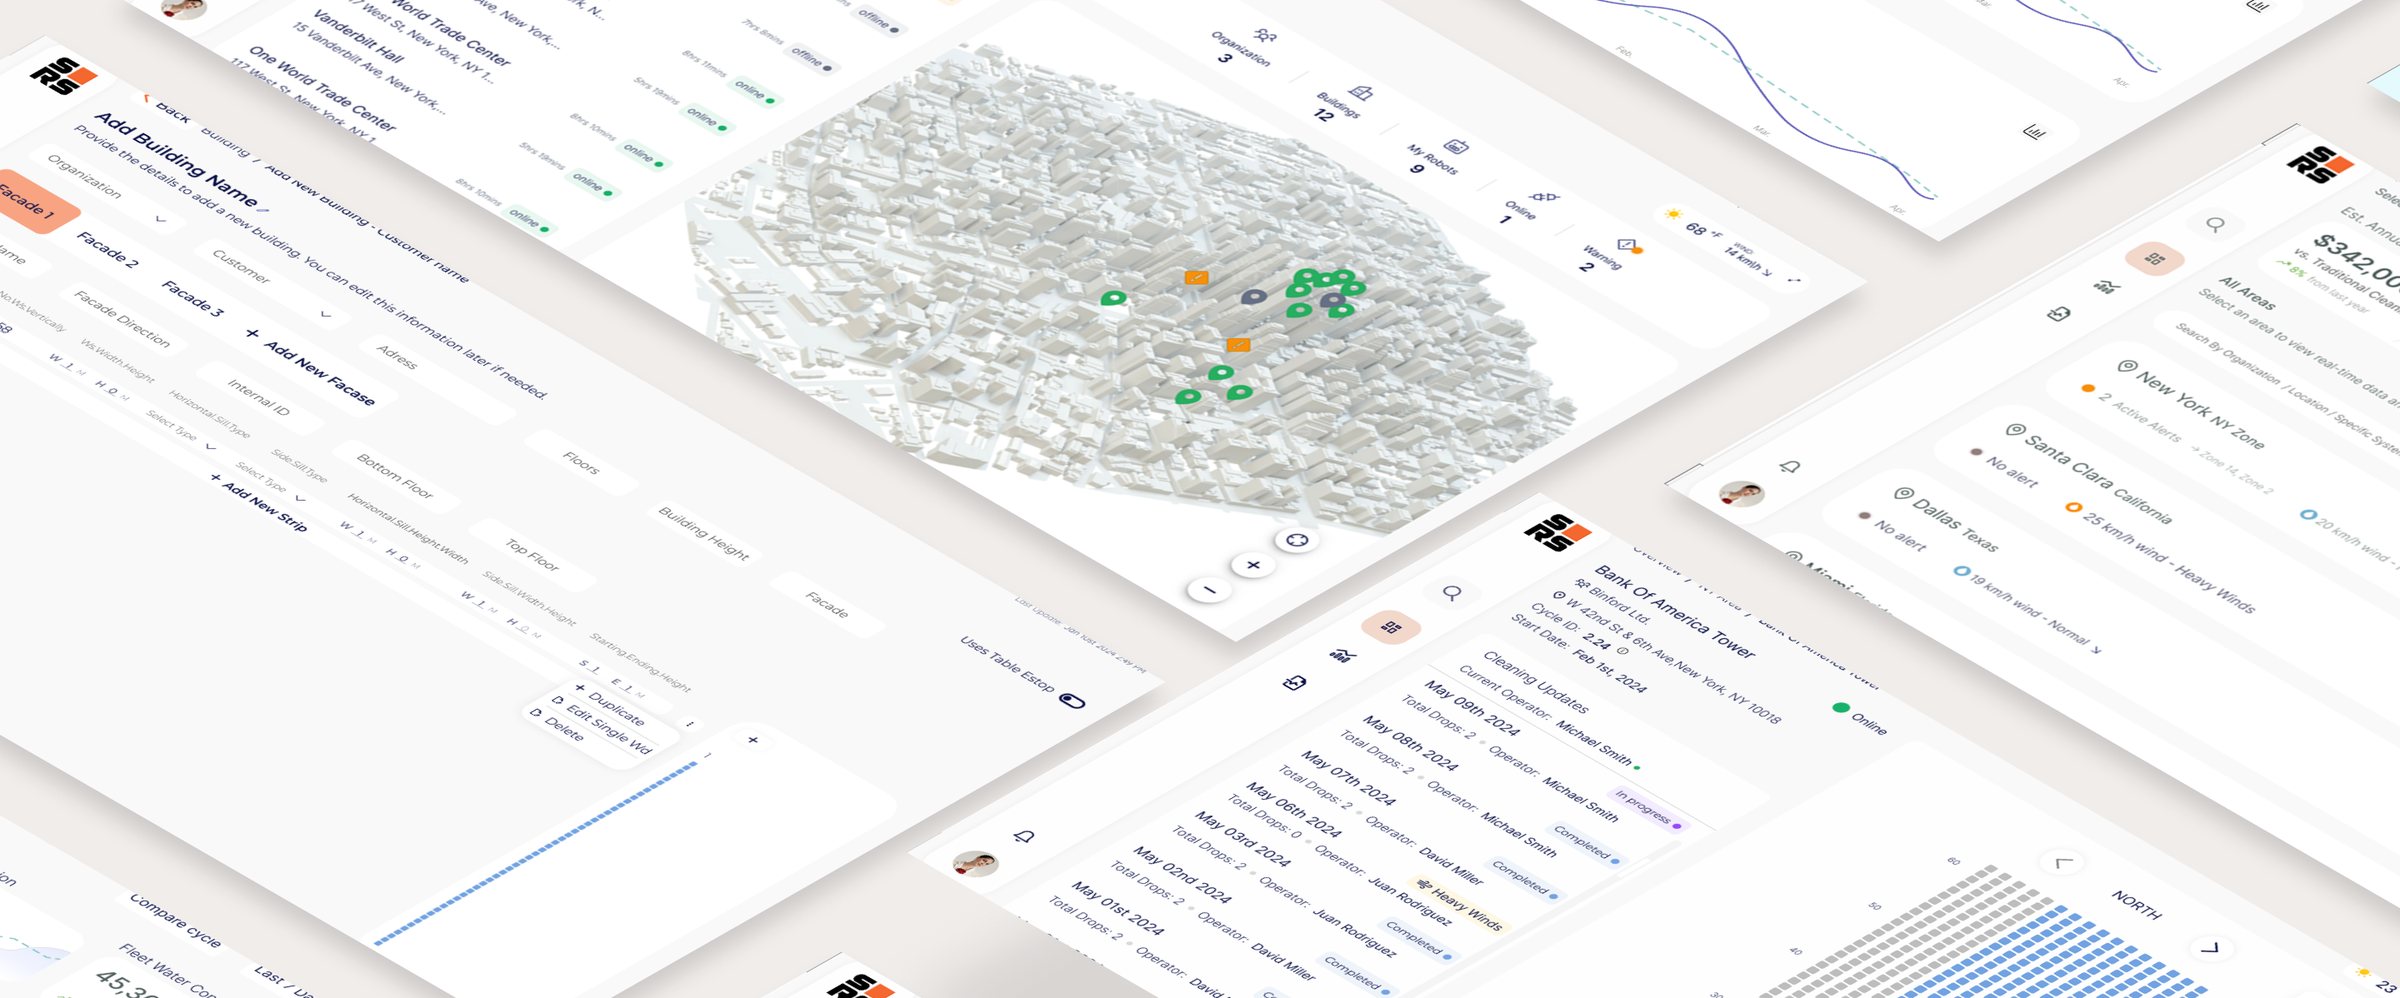
Skyline Robotics builds autonomous robots that clean the windows of skyscrapers. The robots collected a lot of operational data, but the company had no product that let its clients use it.

As the only designer, I designed that product from the ground up: a B2B SaaS platform and its design system, built for three users with different needs. Cleaning company owners track what the fleet saves them, area managers follow every building in real time, and building managers get performance reports.

  • User research
  • Data visualization
  • Design system
  • 0 → 1 product
  • B2B
  • SaaS
Role
Lead Product Designer
Timeline
2024 – 2026
Team
1 Designer, 4 Engineers
Platform
SaaS Platform

The challenge

Without an interface, stakeholders were blind to operations

While robots cleaned buildings across the city, stakeholders remained operationally blind in the office. Without a high-level view of the fleet, they couldn’t detect performance deviations or provide the proof of work needed to justify robotics over manual labor.

Pain points

  • No big-picture view of fleet activity, leading to total reliance on verbal reports.
  • No way to detect recurring issues or deviations from the cleaning schedule.
  • No data-driven evidence of the robots’ efficiency compared to manual labor.
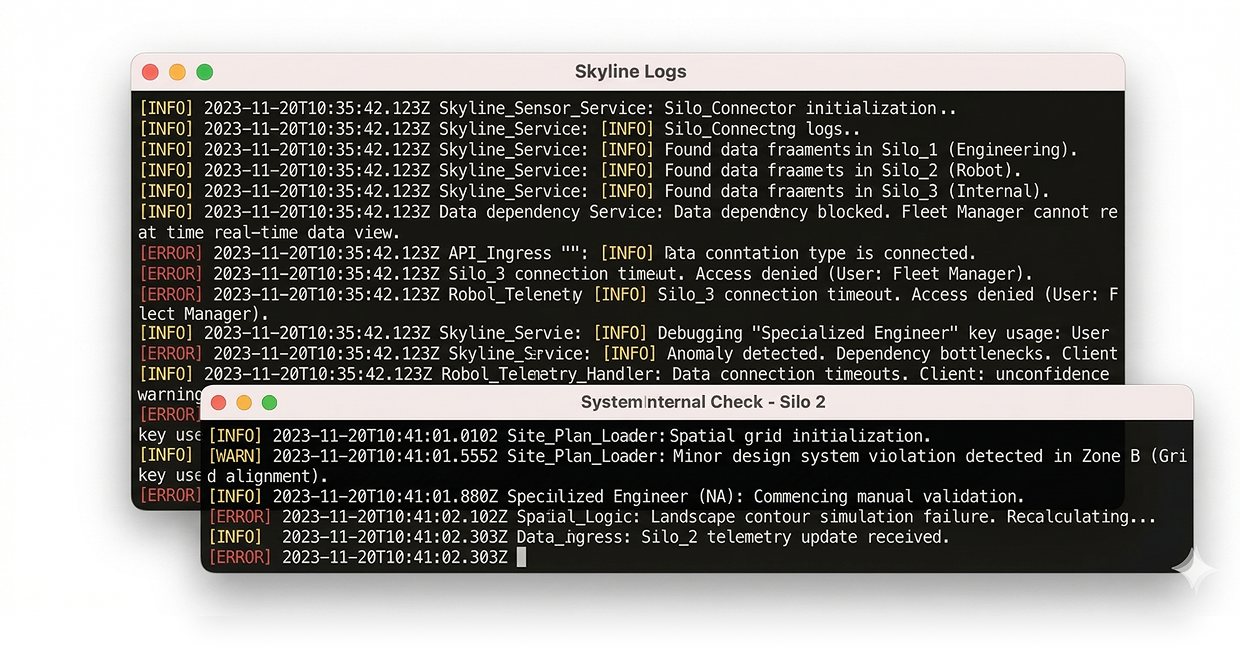
  • Critical business data was trapped in engineering logs, out of reach for decision-makers.
Two terminal windows full of raw Skyline log lines, the only place the data lived

The solution

A hierarchical platform: strategic oversight on top, direct field control below

A unified platform that gives stakeholders a single source of truth. It answers the three most critical questions: Is the fleet working? Are there recurring issues? And is the investment paying off? It also gives managers the real-time control to keep daily operations on schedule.

Key features

  • Real-time fleet status: instant visibility across all sites.
  • Recurring trend analysis: identifying systematic issues before they escalate.
  • Automated value metrics: live tracking of savings and operational efficiency.
  • Deep-dive hierarchy: a seamless move from the city view to a single robot.
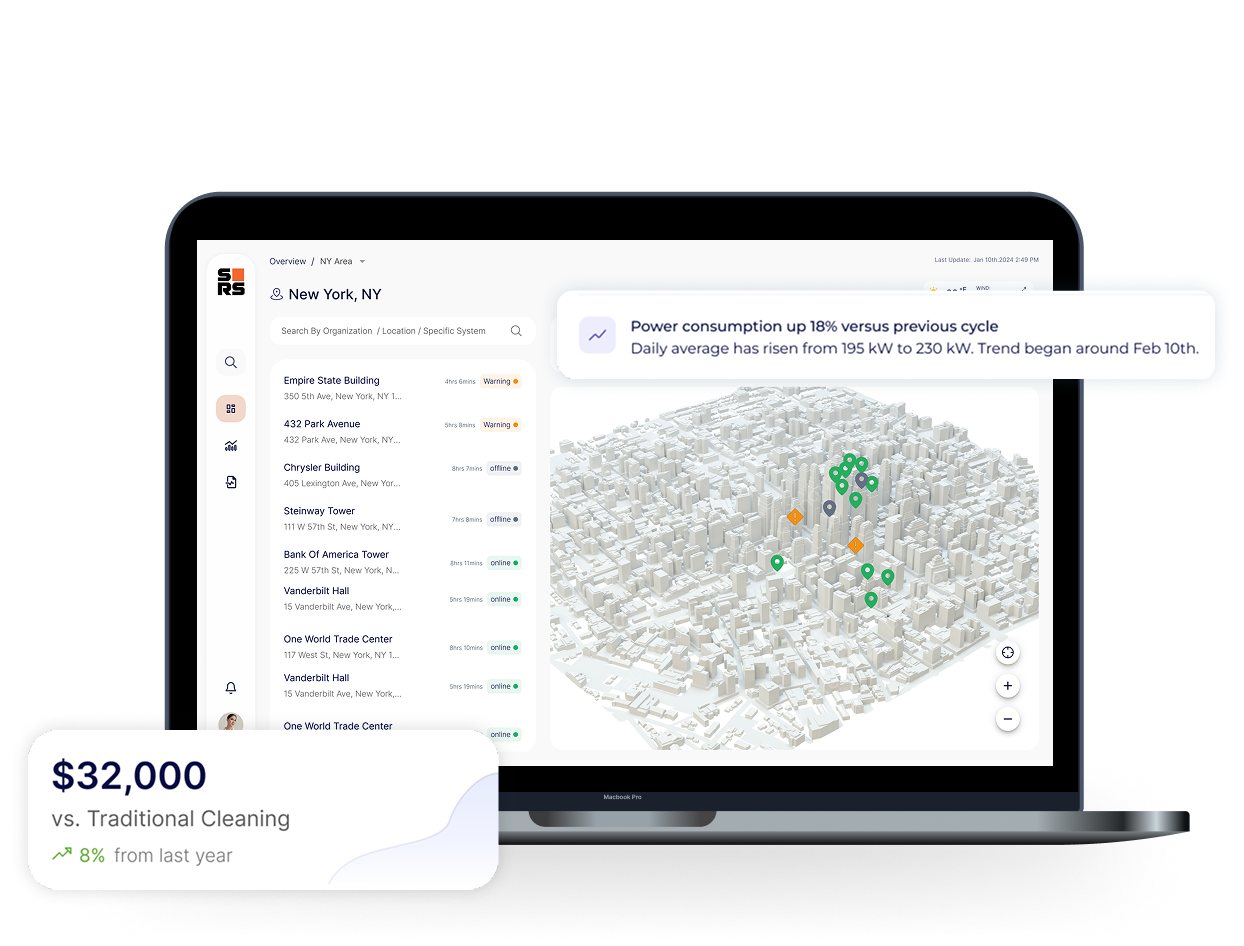
The regional dashboard on a laptop, with a savings card and a power-consumption alert floating beside it

Success criteria

  • Self-serve insights

    Owners and managers find what they need without asking anyone.

  • Reduced support overhead

    Routine status questions answered by the platform, not by the engineering team.

  • Lower operational risk

    Deviations and weather risks are visible early, before they turn into missed cleanings.

Four things the platform does

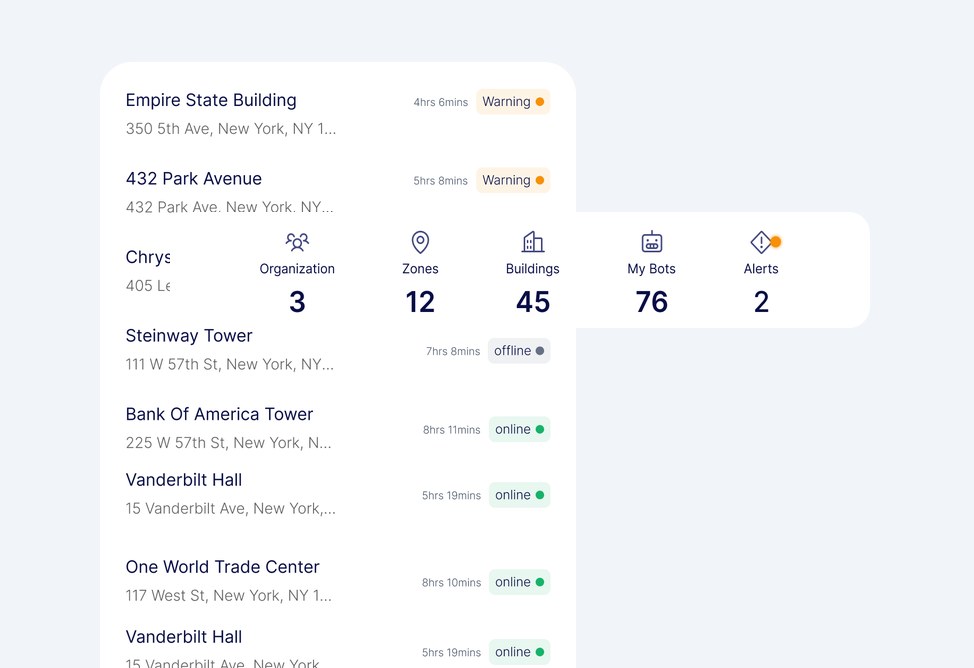
Building list with live statuses and a fleet summary bar

Oversee

A unified hub providing real-time fleet visibility.

Unified fleet pulse • Live status indicators • Global asset tracking

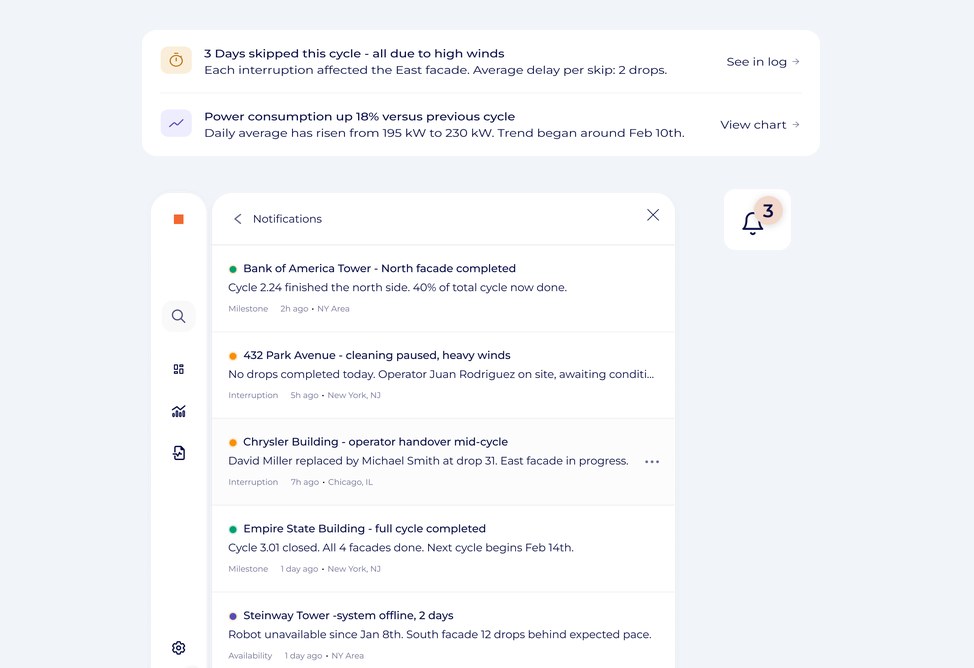
Alerts about weather skips and power use above a notifications panel

Respond

Proactive alerts for performance deviations and risks.

Smart deviation alerts • Risk-based notifications • Immediate action triggers

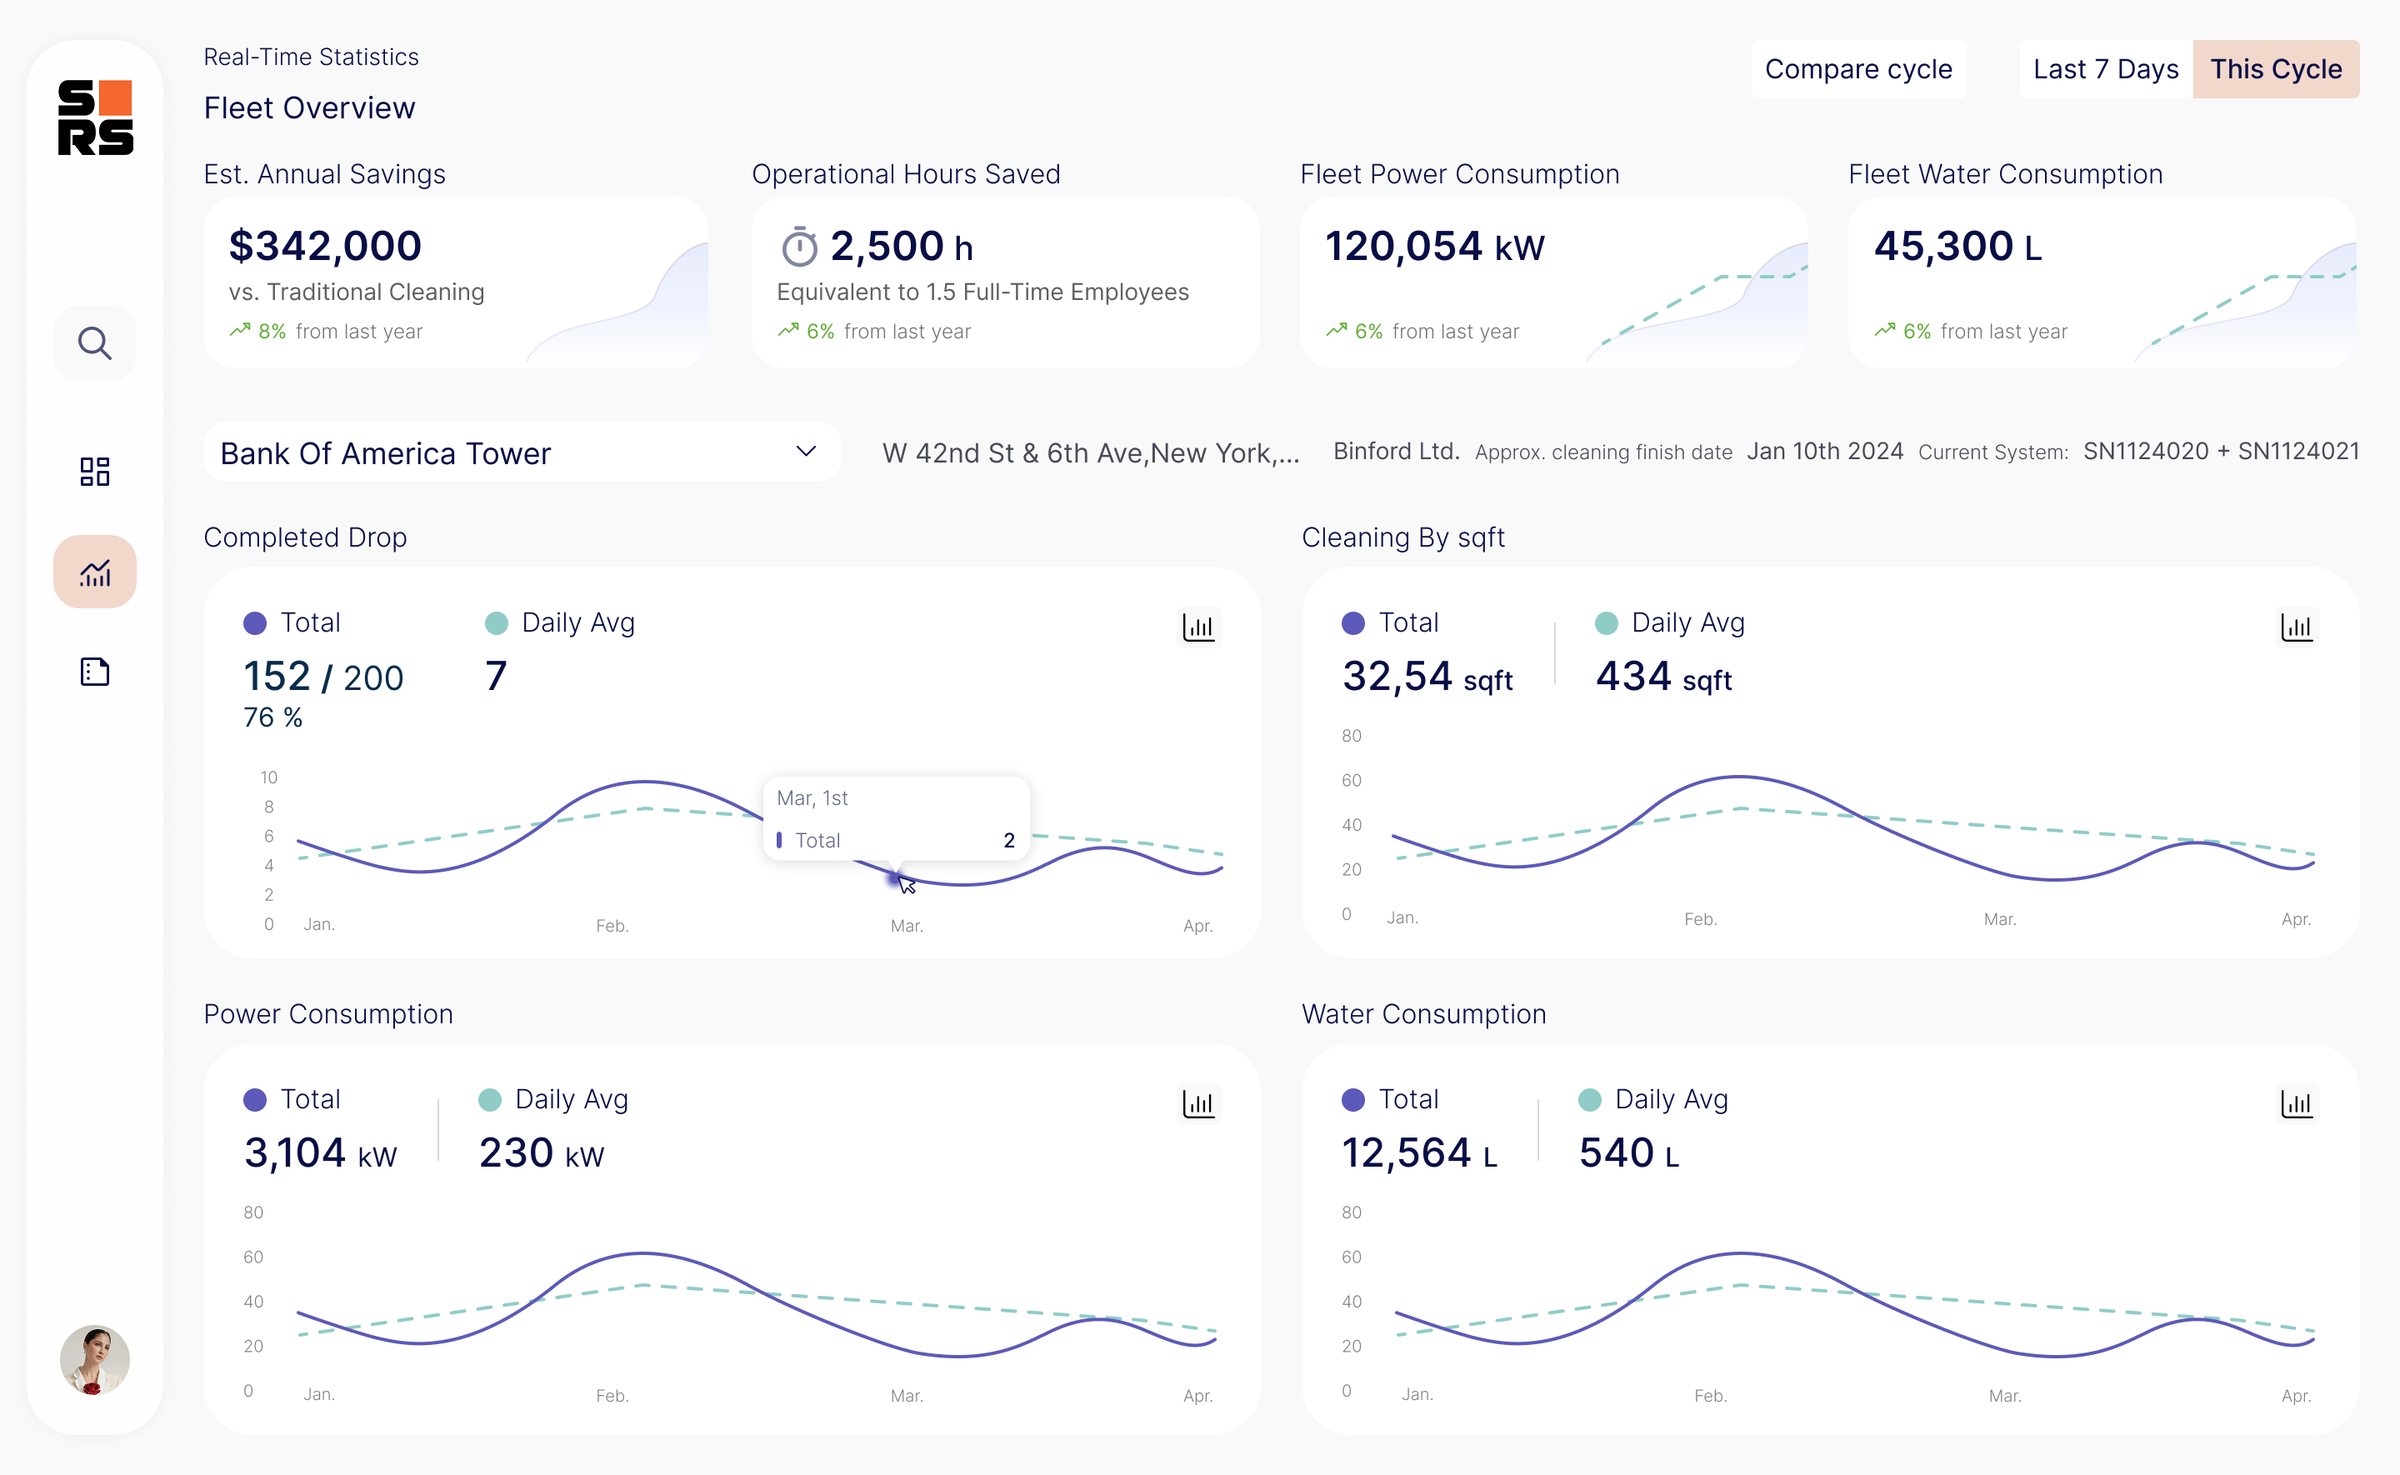
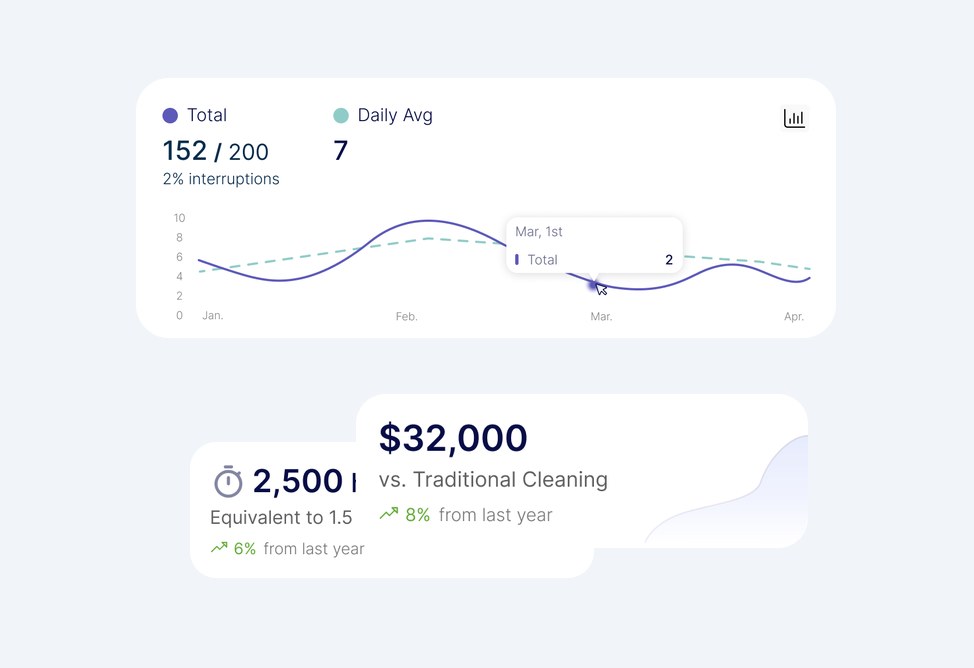
Completed drops chart with savings and hours-saved cards

Validate

Financial metrics to verify ROI and labor efficiency.

Automated ROI tracking • Labor efficiency metrics • Cost vs. savings audit

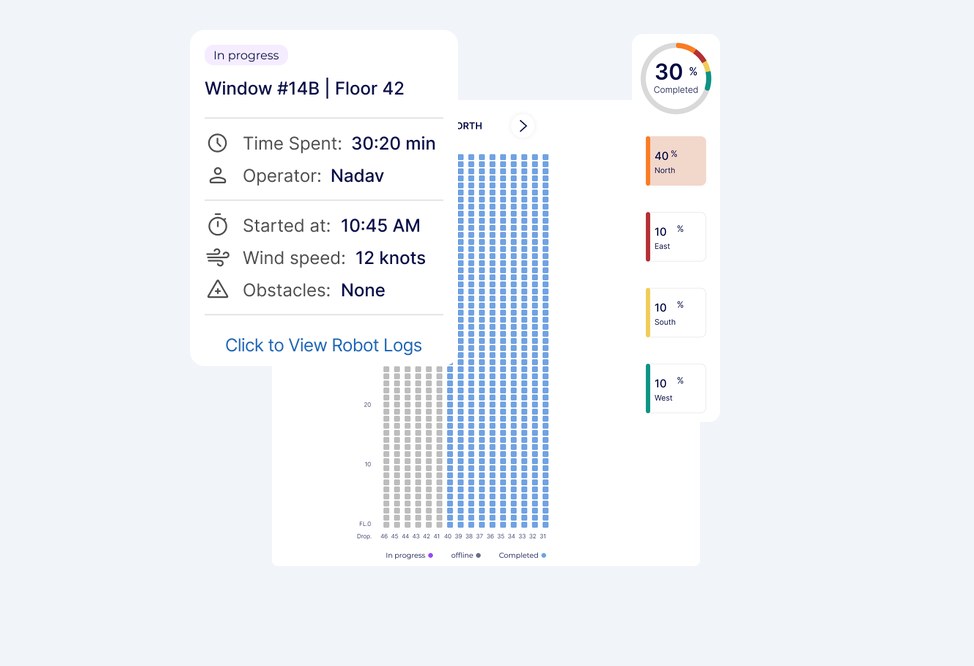
Window detail card over a facade grid with completion per facade

Explore

Granular drill-down from the fleet overview to window level.

Spatial drill-down • Granular unit diagnostics • Multi-level navigation

Figures shown are sample data.

Key design decisions

Three decisions that shaped the platform

01

One hierarchy, two entry points

Problem: Owners and area managers look at the same data for different reasons. An owner asks “Is the fleet working, and is it worth it?” An area manager asks “What’s happening in my buildings right now?”

Decision: I designed a drill-down hierarchy (fleet → region → building → window) with a different entry point for each persona. Owners land on the fleet overview, area managers on their region.

Why: Owners need the big picture and only drill down when something goes wrong. Managers start where their daily work is. Neither has to dig through a view built for the other.

Shown in: Global Fleet Overview → Building Deep-Dive
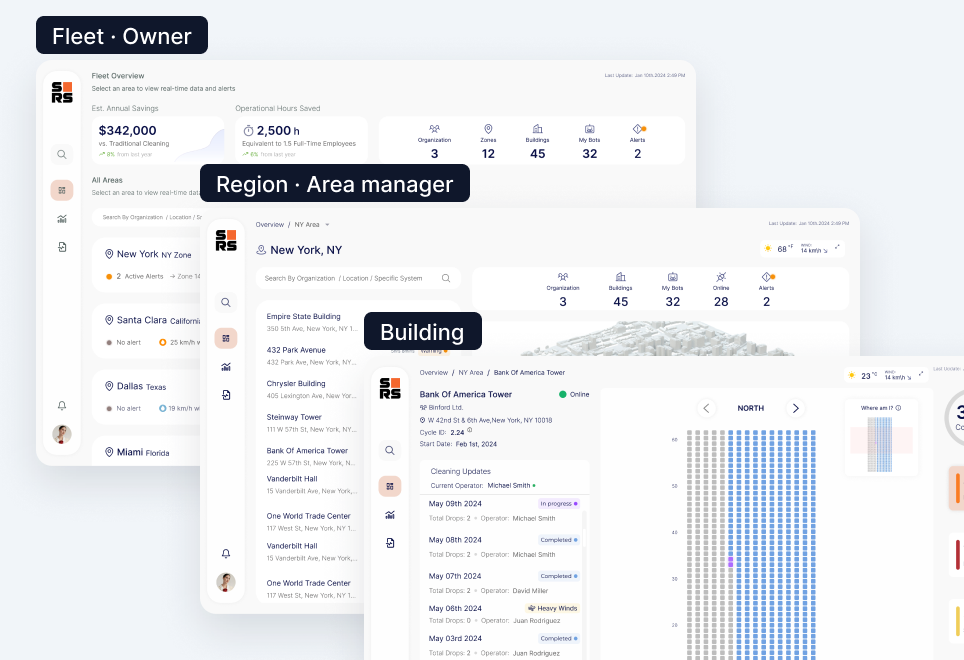
Three stacked screens labeled Fleet (owner), Region (area manager) and Building
02

Progress you can see on the building

Problem: Area managers need to know exactly where the robot is working and what’s left. Most of them are field people who spend the day outside, not analysts.

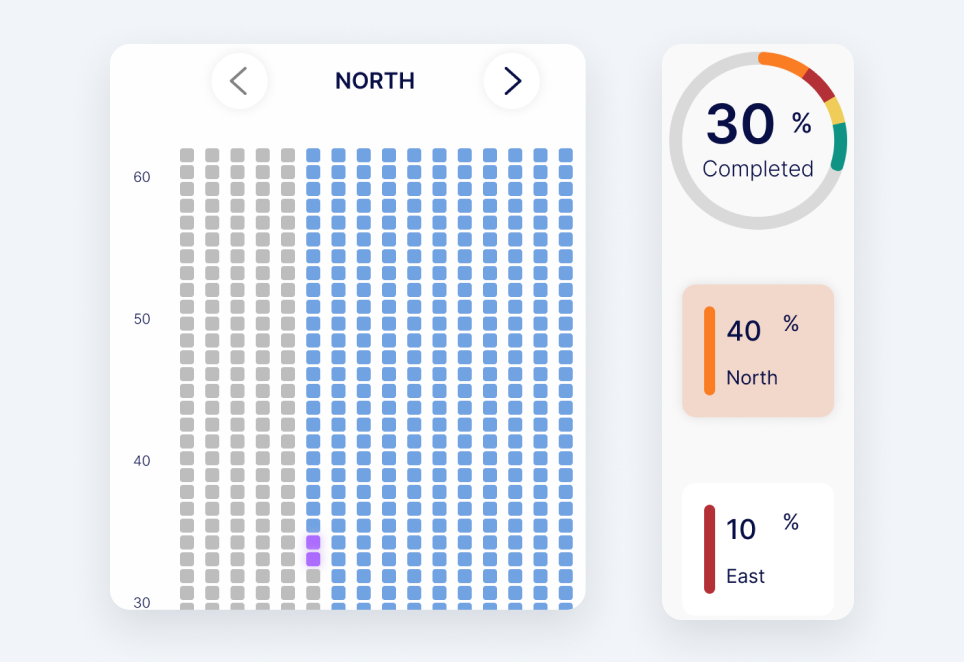
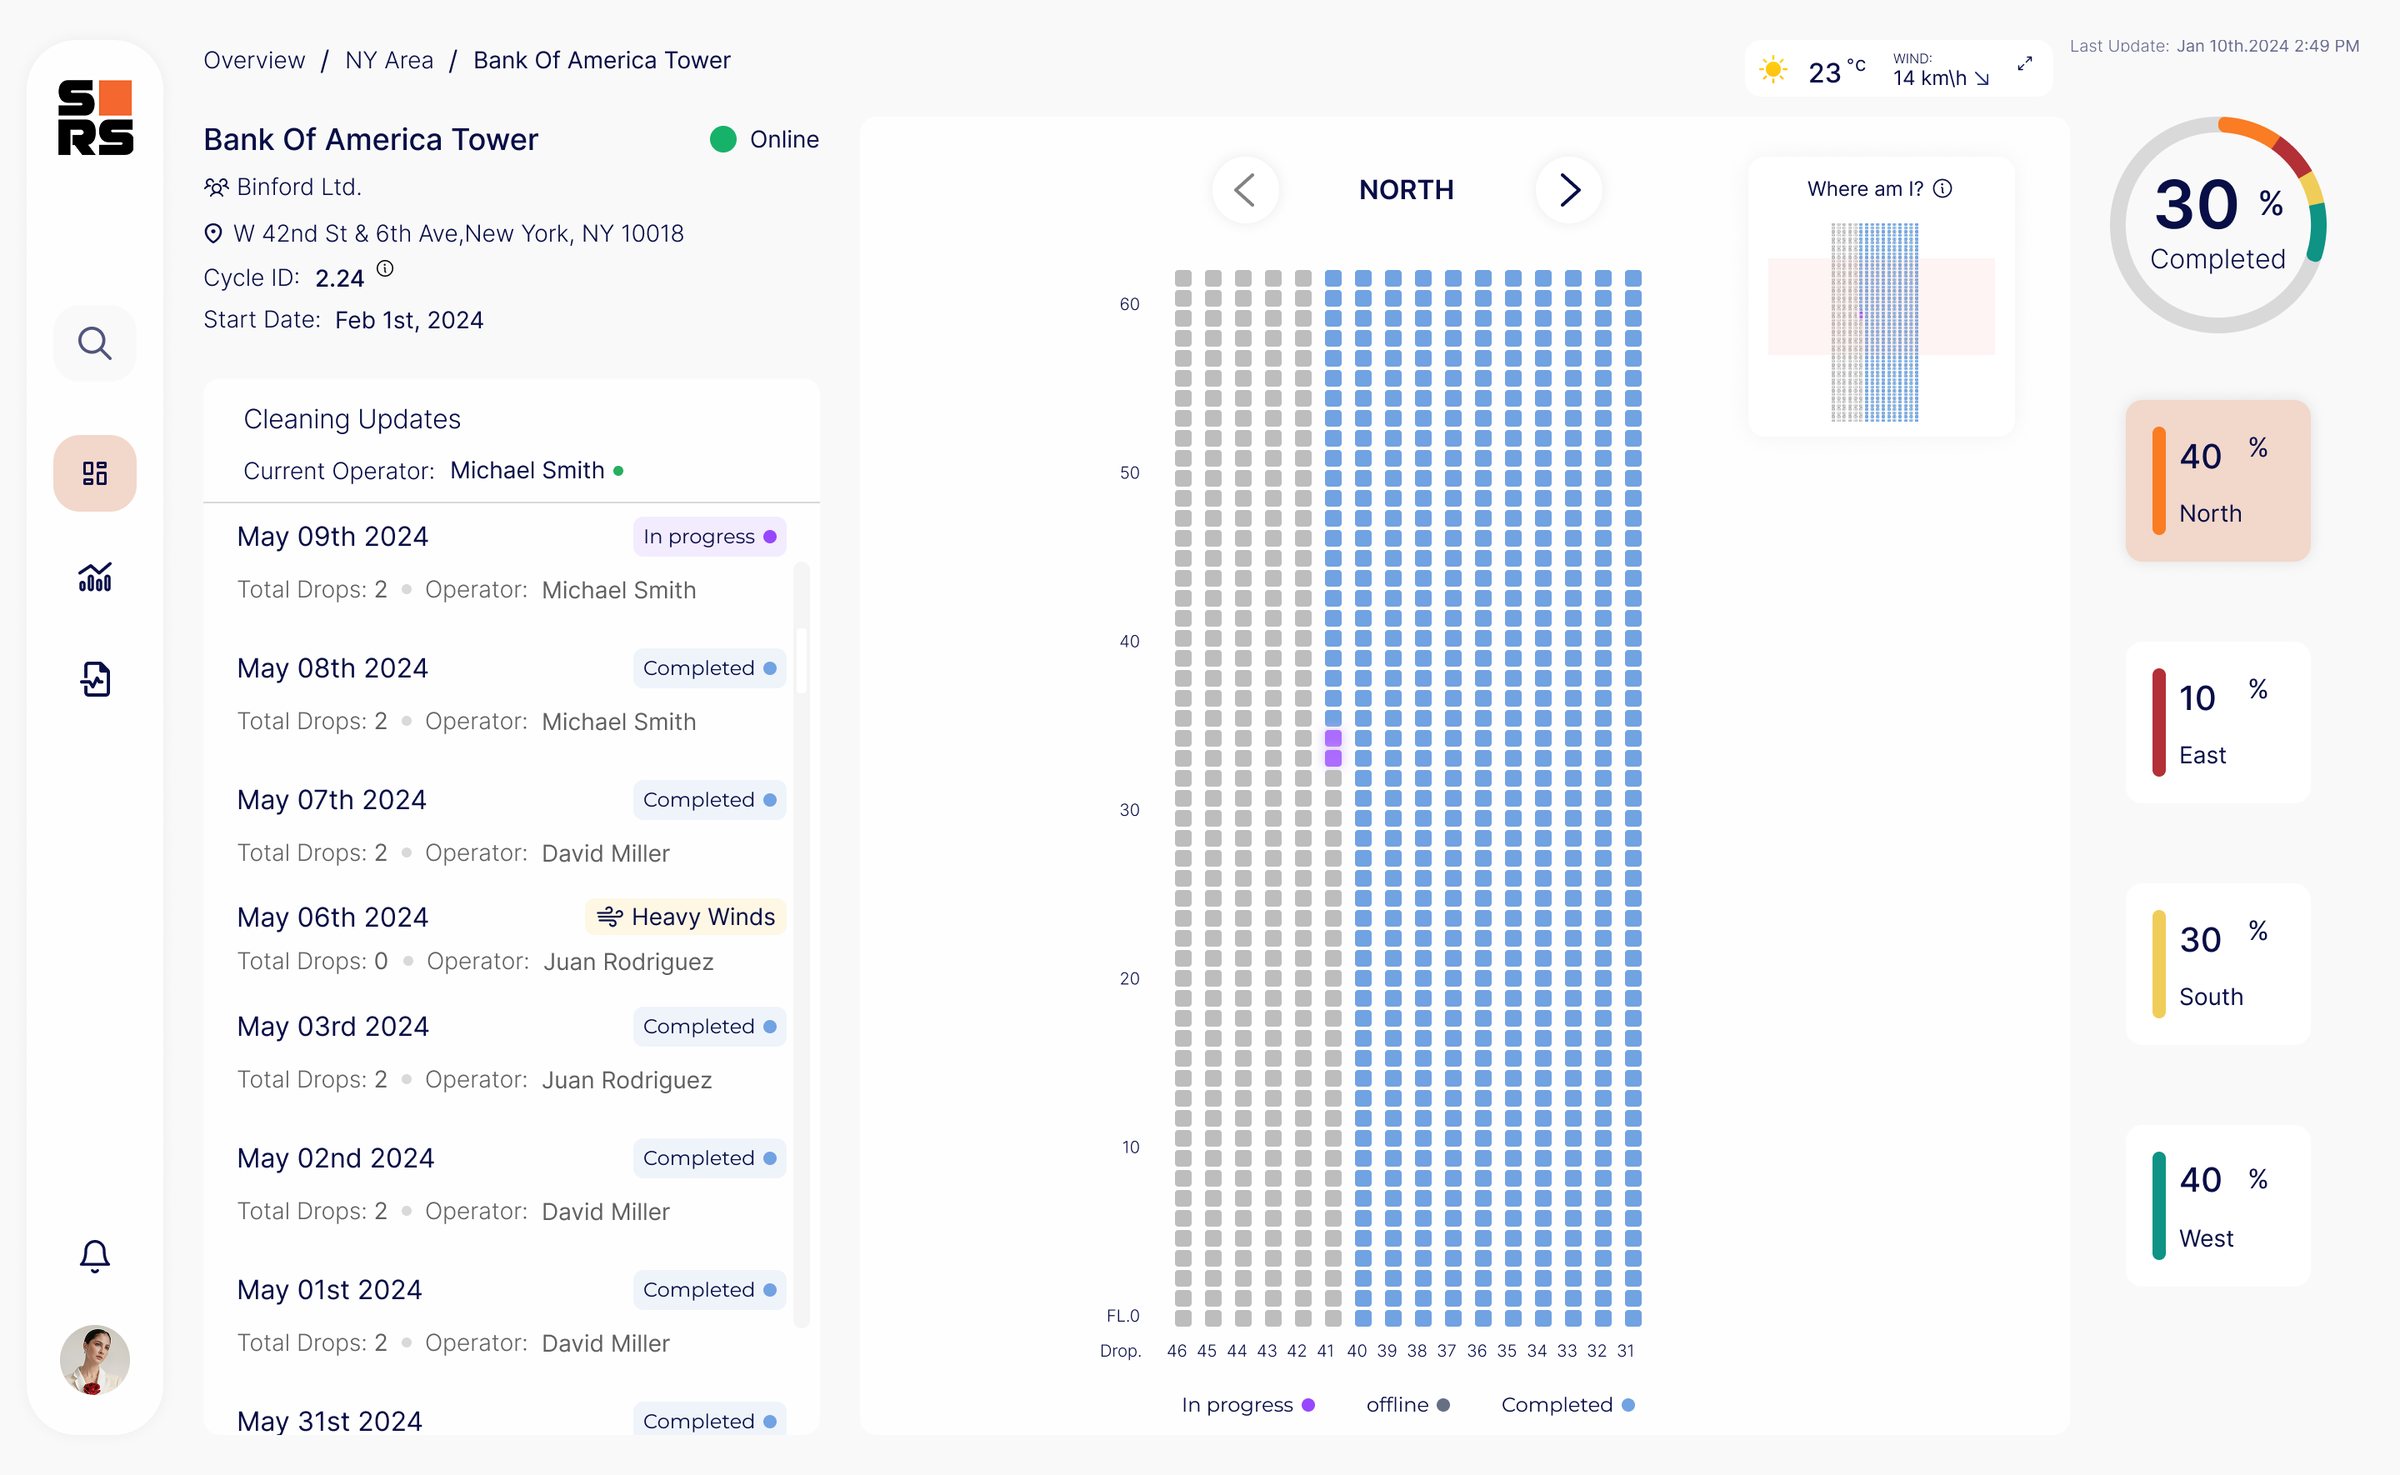
Decision: Instead of a percentage or a progress bar, I showed progress as a live grid of the building’s windows, facade by facade, with each window’s status.

Why: A percentage tells you how much is done; the grid shows exactly which windows. For field people, a visual they can read at a glance is easier than numbers.

Shown in: Building Deep-Dive

A window grid for the north facade, with completed windows in blue, next to completion percentages per facade
03

Weather where the decision happens

Problem: Wind and weather decide whether robots can operate safely, and checking them meant switching to another app.

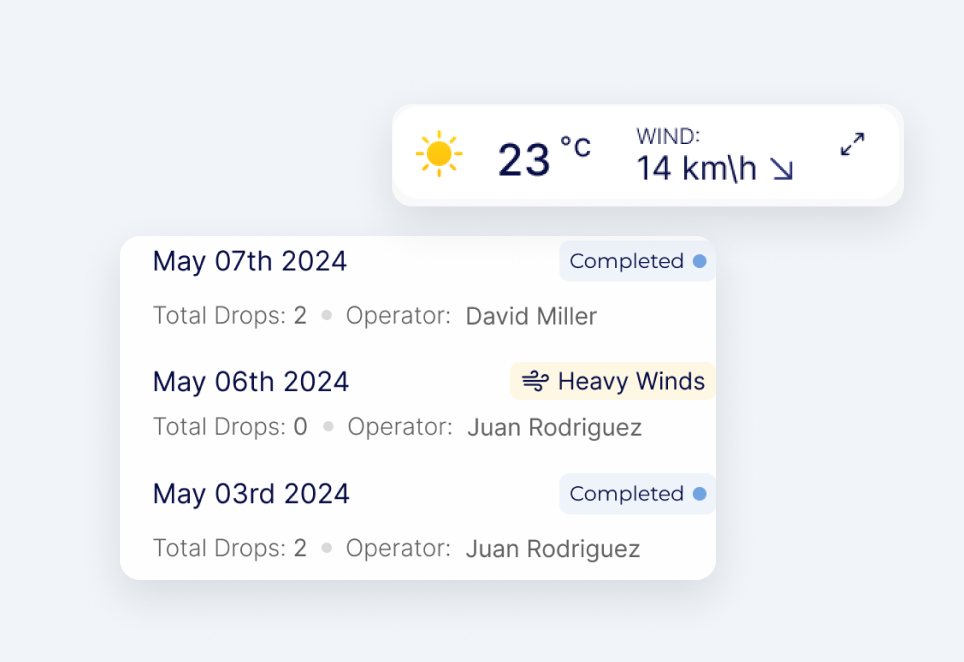
Decision: I placed live weather and wind data next to the cleaning status, and flagged weather stops directly in the cleaning log (“Heavy Winds”).

Why: When a cleaning is paused, the reason is right there, so managers understand it without leaving the platform.

Shown in: Regional Drill-Down and Building Deep-Dive

A weather widget showing 23°C and wind of 14 km/h above a cleaning log with a “Heavy Winds” entry

Information architecture

Defining the system flows

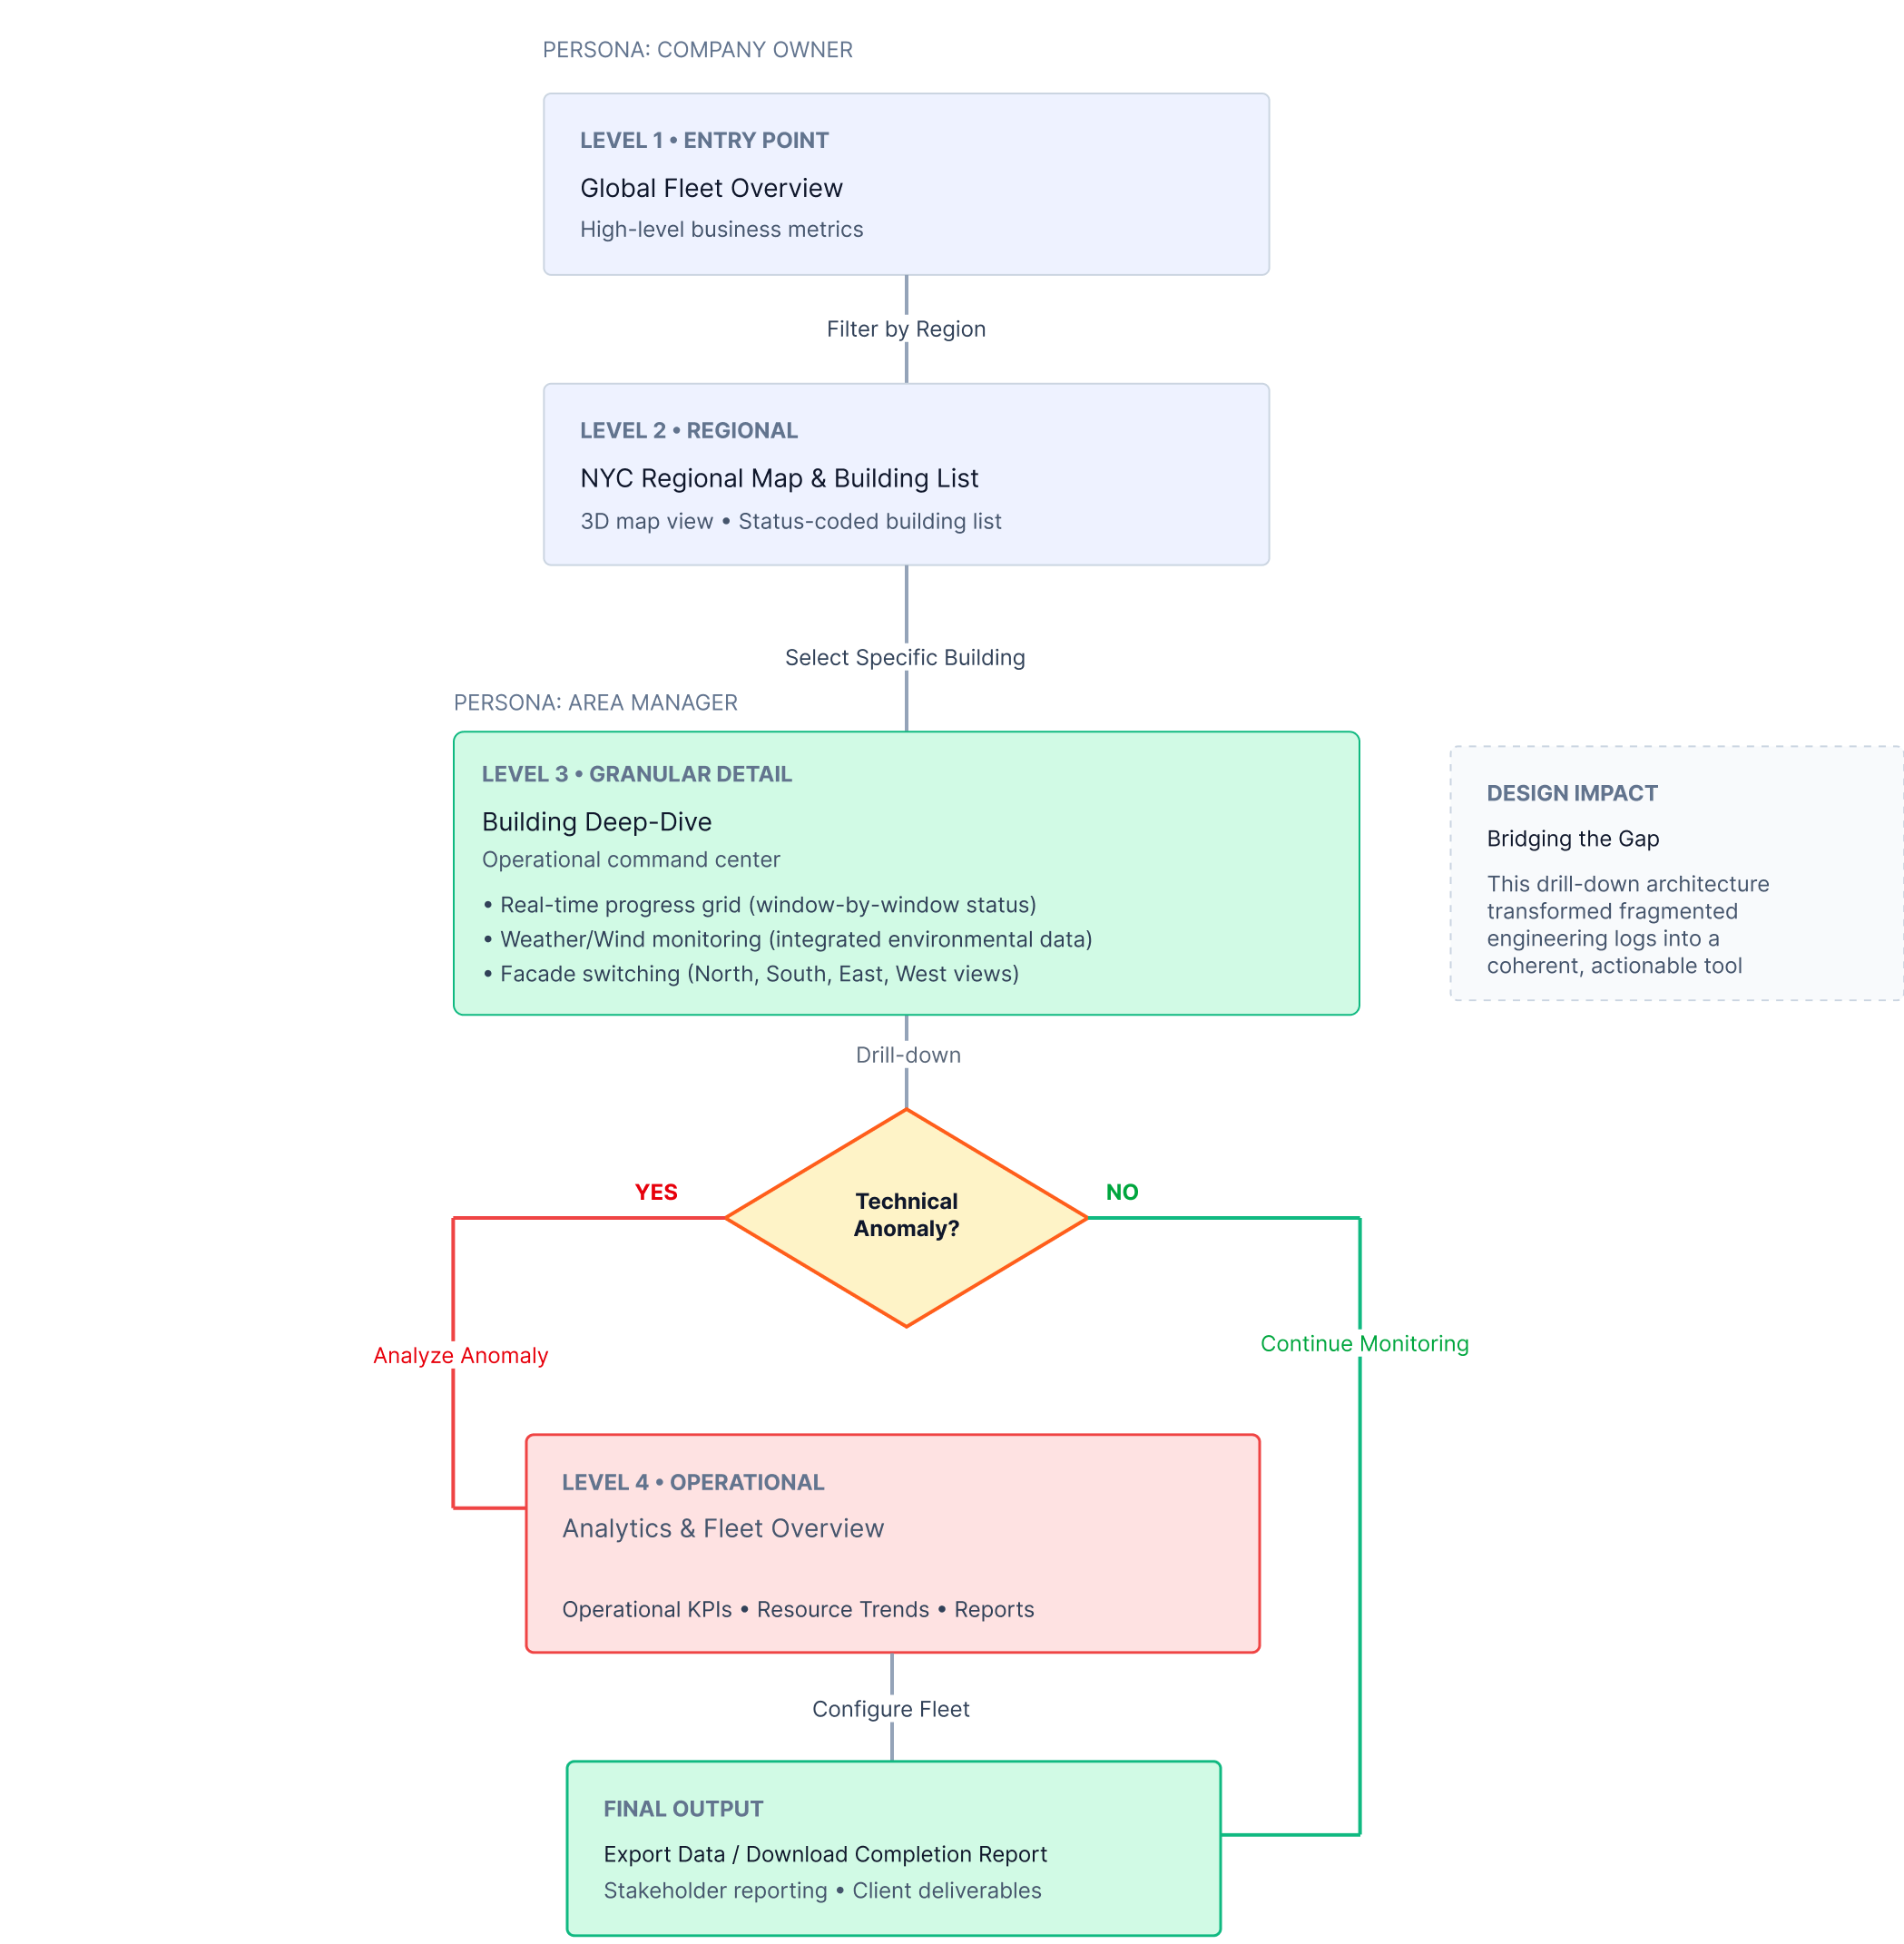
To serve both the company owner’s big-picture needs and the area manager’s operational detail, I designed a four-level drill-down: from a Global Fleet Overview down to a single building’s window-level status, and on to its analytics. Data is never overwhelming, and fragmented engineering logs became one actionable tool.

  1. 1Entry point

    Global Fleet Overview

    Owner KPI view • High-level business metrics

  2. 2Regional

    NYC map & building list

    Filter by region • Spatial context

  3. 3Building detail

    Window-by-window progress

    Operational view • Real-time data

  4. 4Management

    Analytics & fleet KPIs

    Operational KPIs • Resource trends

Flow diagram: the business stakeholder enters at the global fleet overview, filters by region and selects a building; the ops manager works at building level, analyses anomalies or keeps monitoring, and exports completion reports

The platform

From the whole fleet down to a single window

The way in

Login: Facade Analytics

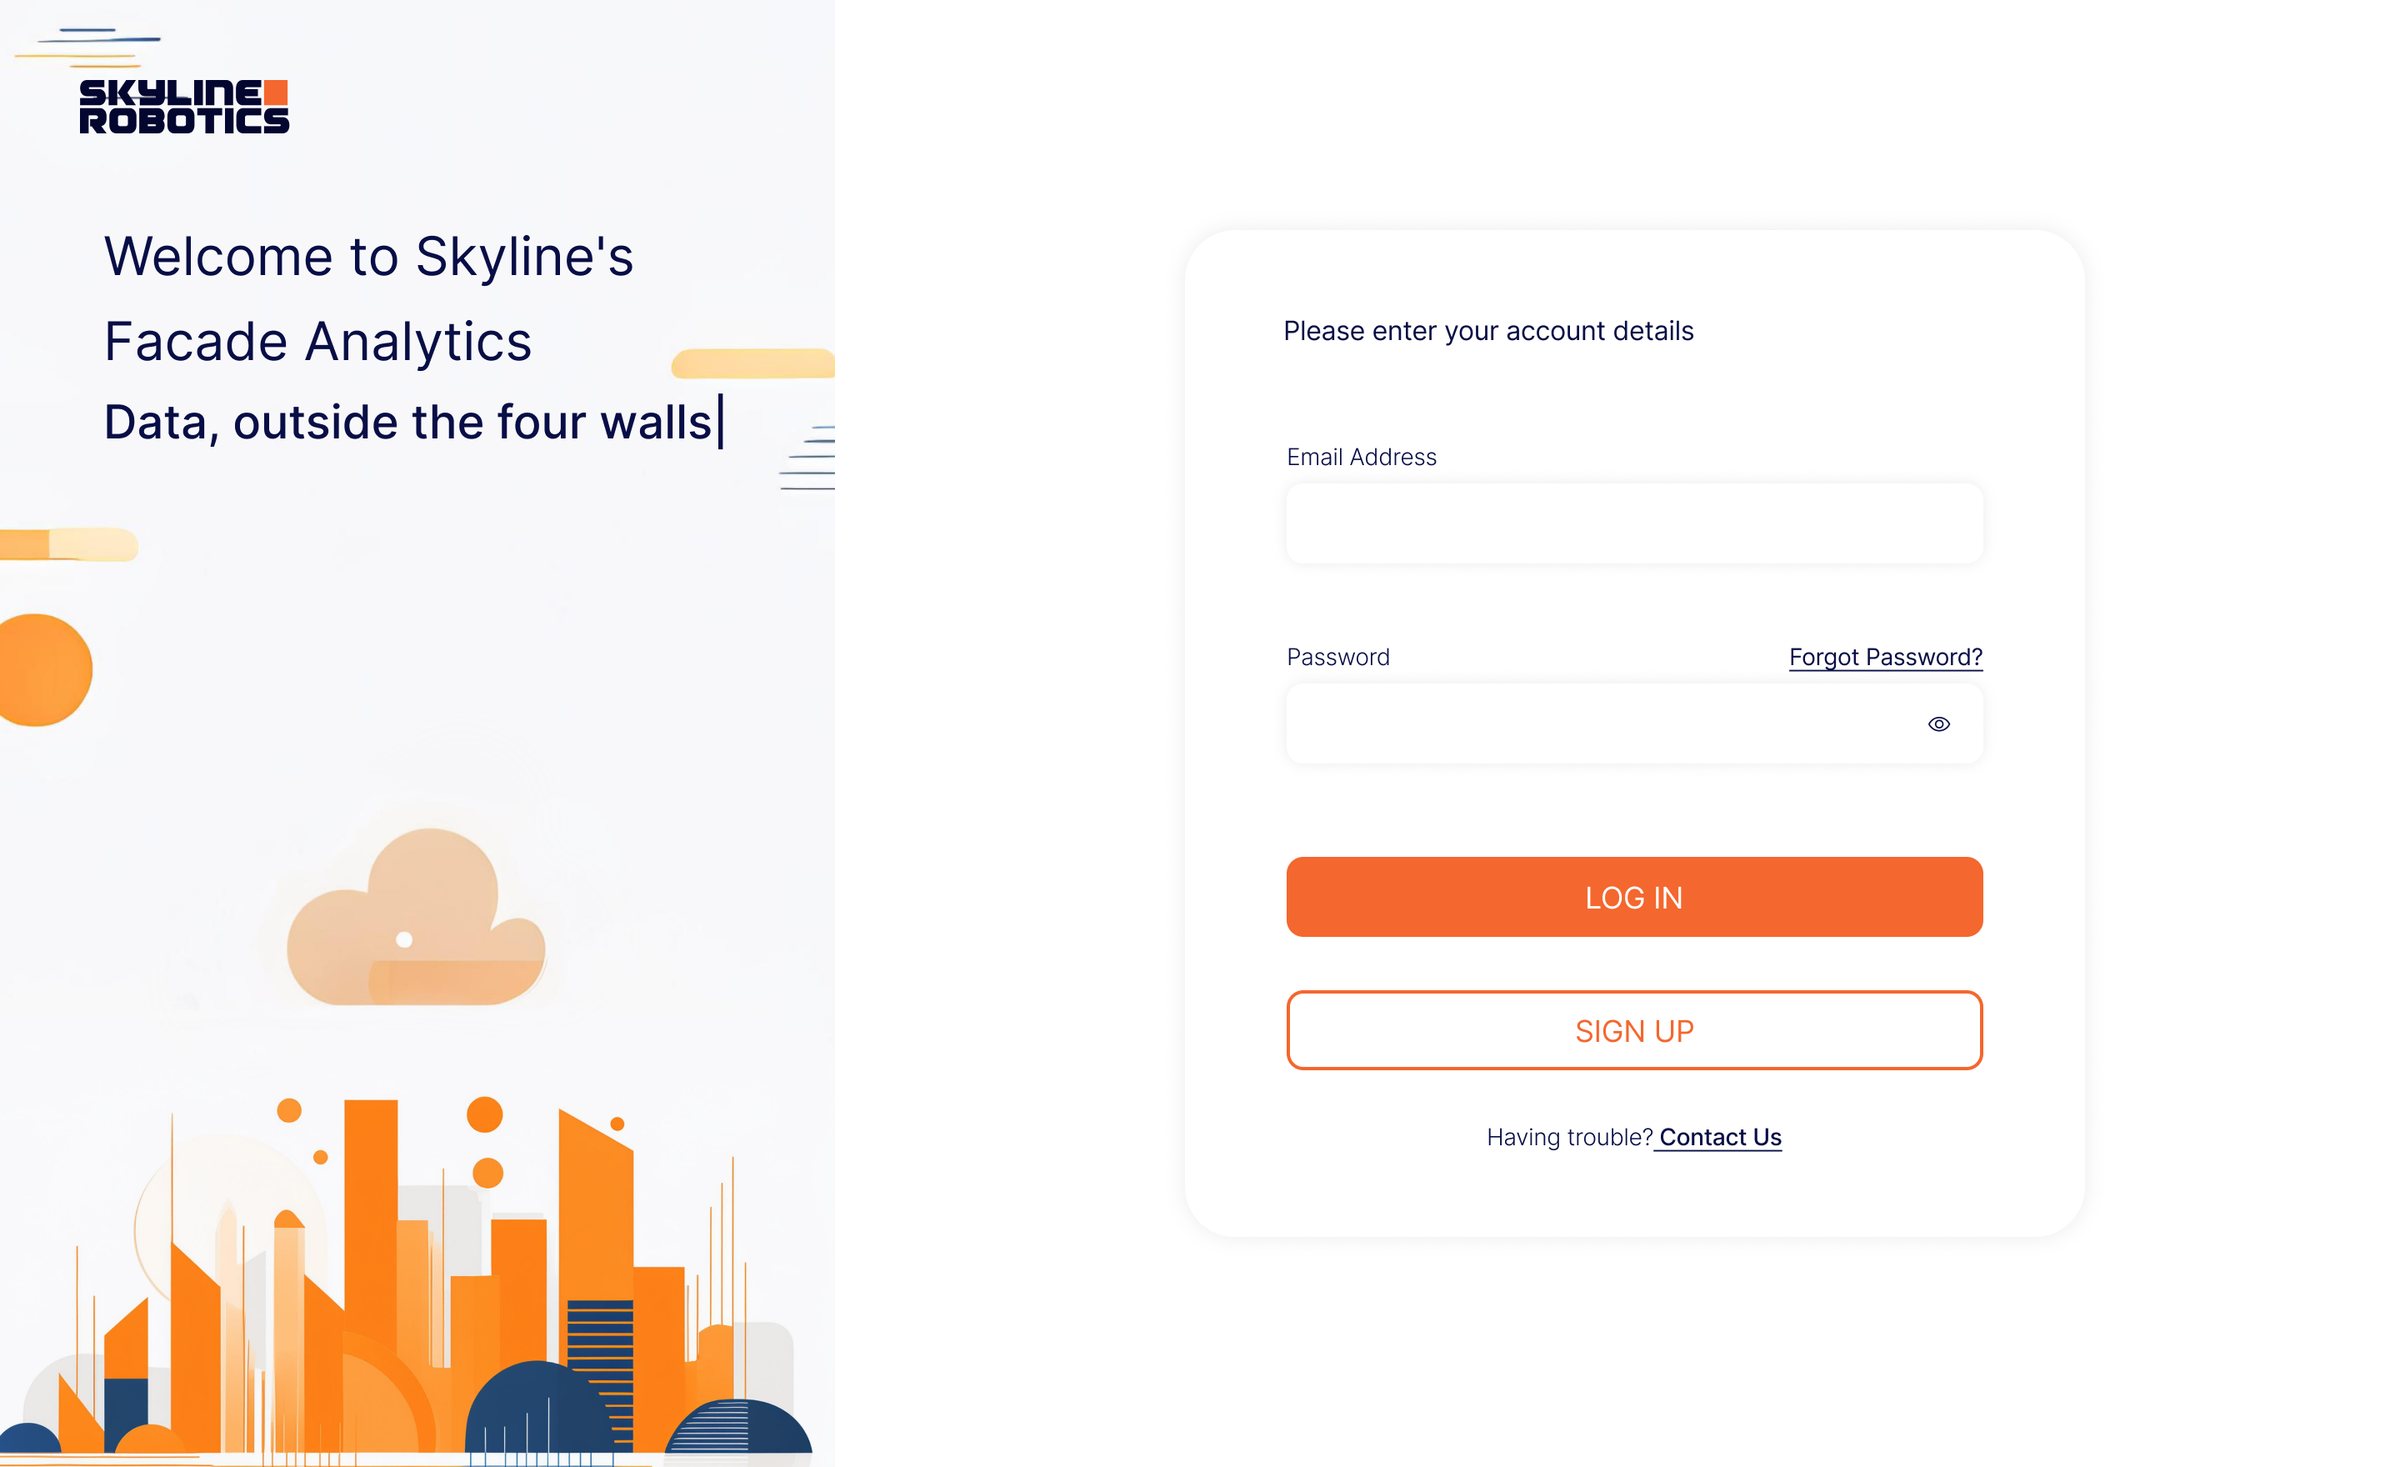
The entry point puts data access first. The illustration carries the core idea: visibility beyond the four walls of building management.

Login screen: “Welcome to Skyline’s Facade Analytics. Data, outside the four walls” next to the sign-in form
  • Brand identity

    Clean Skyline Robotics branding builds trust from the first interaction.

  • Visual metaphor

    An AI-generated illustration communicates the mission: data visibility beyond traditional boundaries.

  • Minimal sign-in

    A short sign-in removes friction while keeping enterprise security standards.

Level 1 · Entry point

Global Fleet Overview

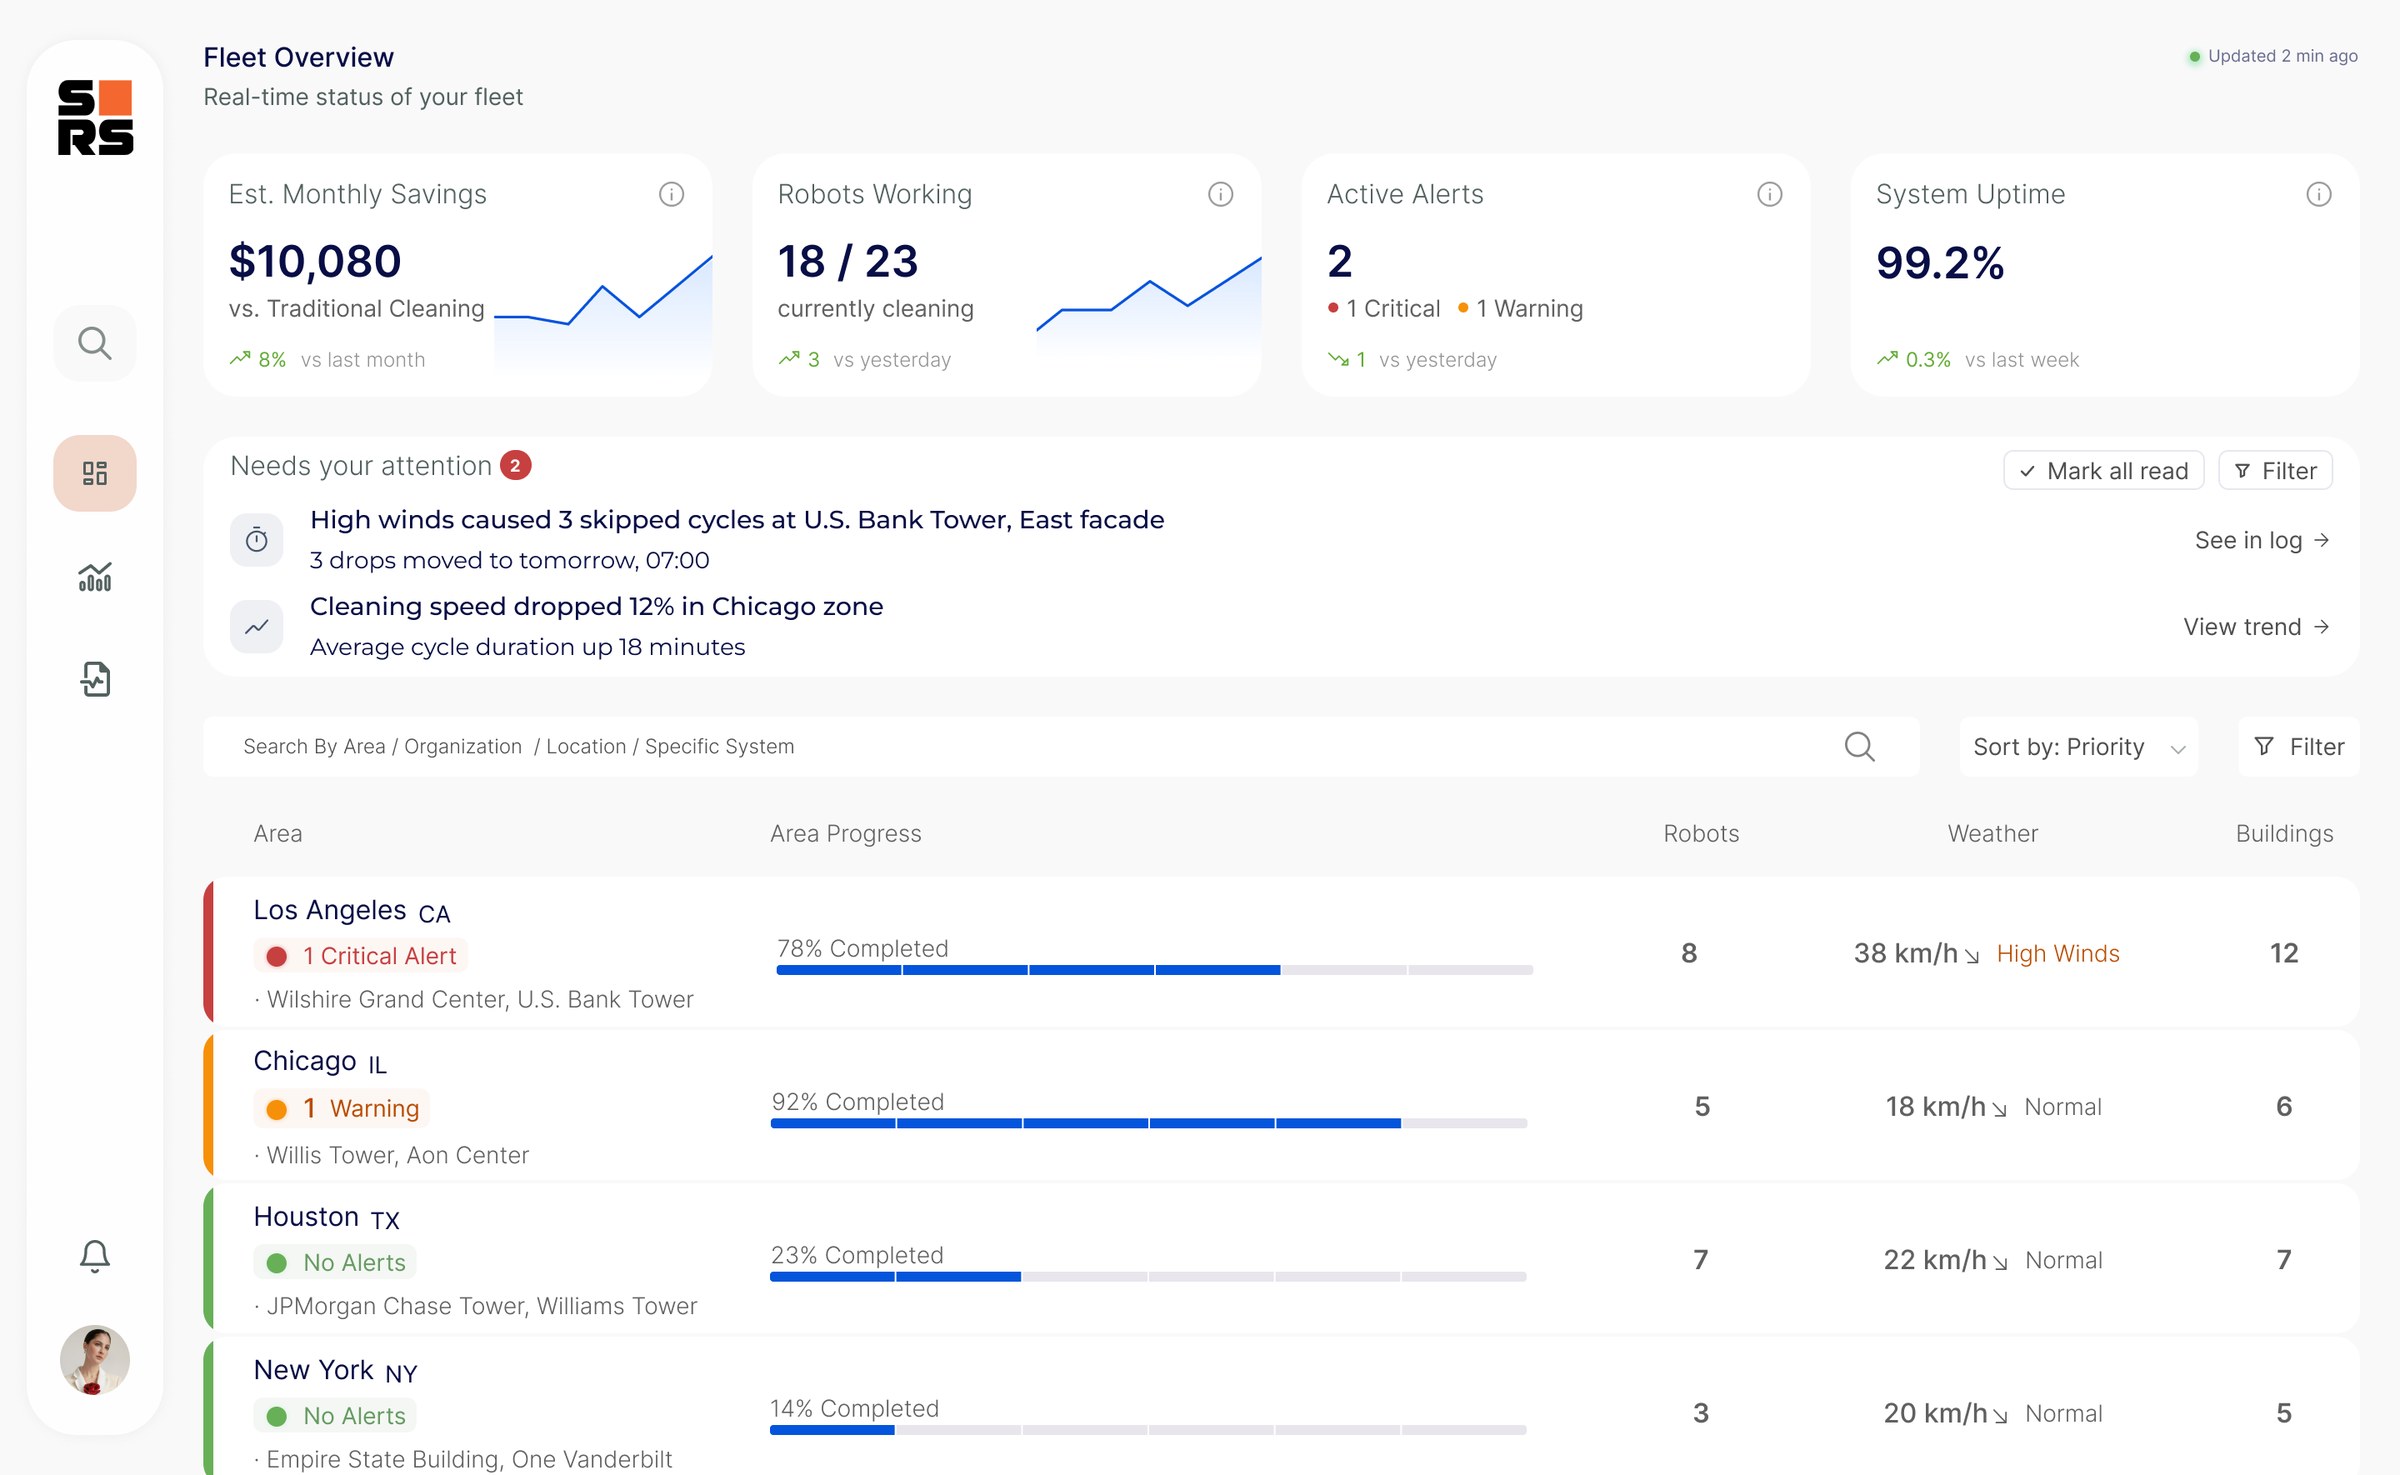
The owner’s entry point answers one question first: is anything wrong right now? What needs attention sits above the areas, and the areas are sorted by priority.

Fleet overview: savings, robots working, active alerts and uptime; a Needs your attention list with a high-wind stop in Los Angeles and a slowdown in Chicago; and areas sorted by priority with progress, robots, weather and buildings

Figures shown are sample data.

  • KPI cards

    Savings, robots working, active alerts and uptime, each with its trend.

  • Needs your attention

    The few issues that need a decision, each with a direct link to the log or the trend.

  • Areas by priority

    Critical first, with a color edge, progress, robots and live weather per area.

Level 2 · Regional

Regional Drill-Down (NYC)

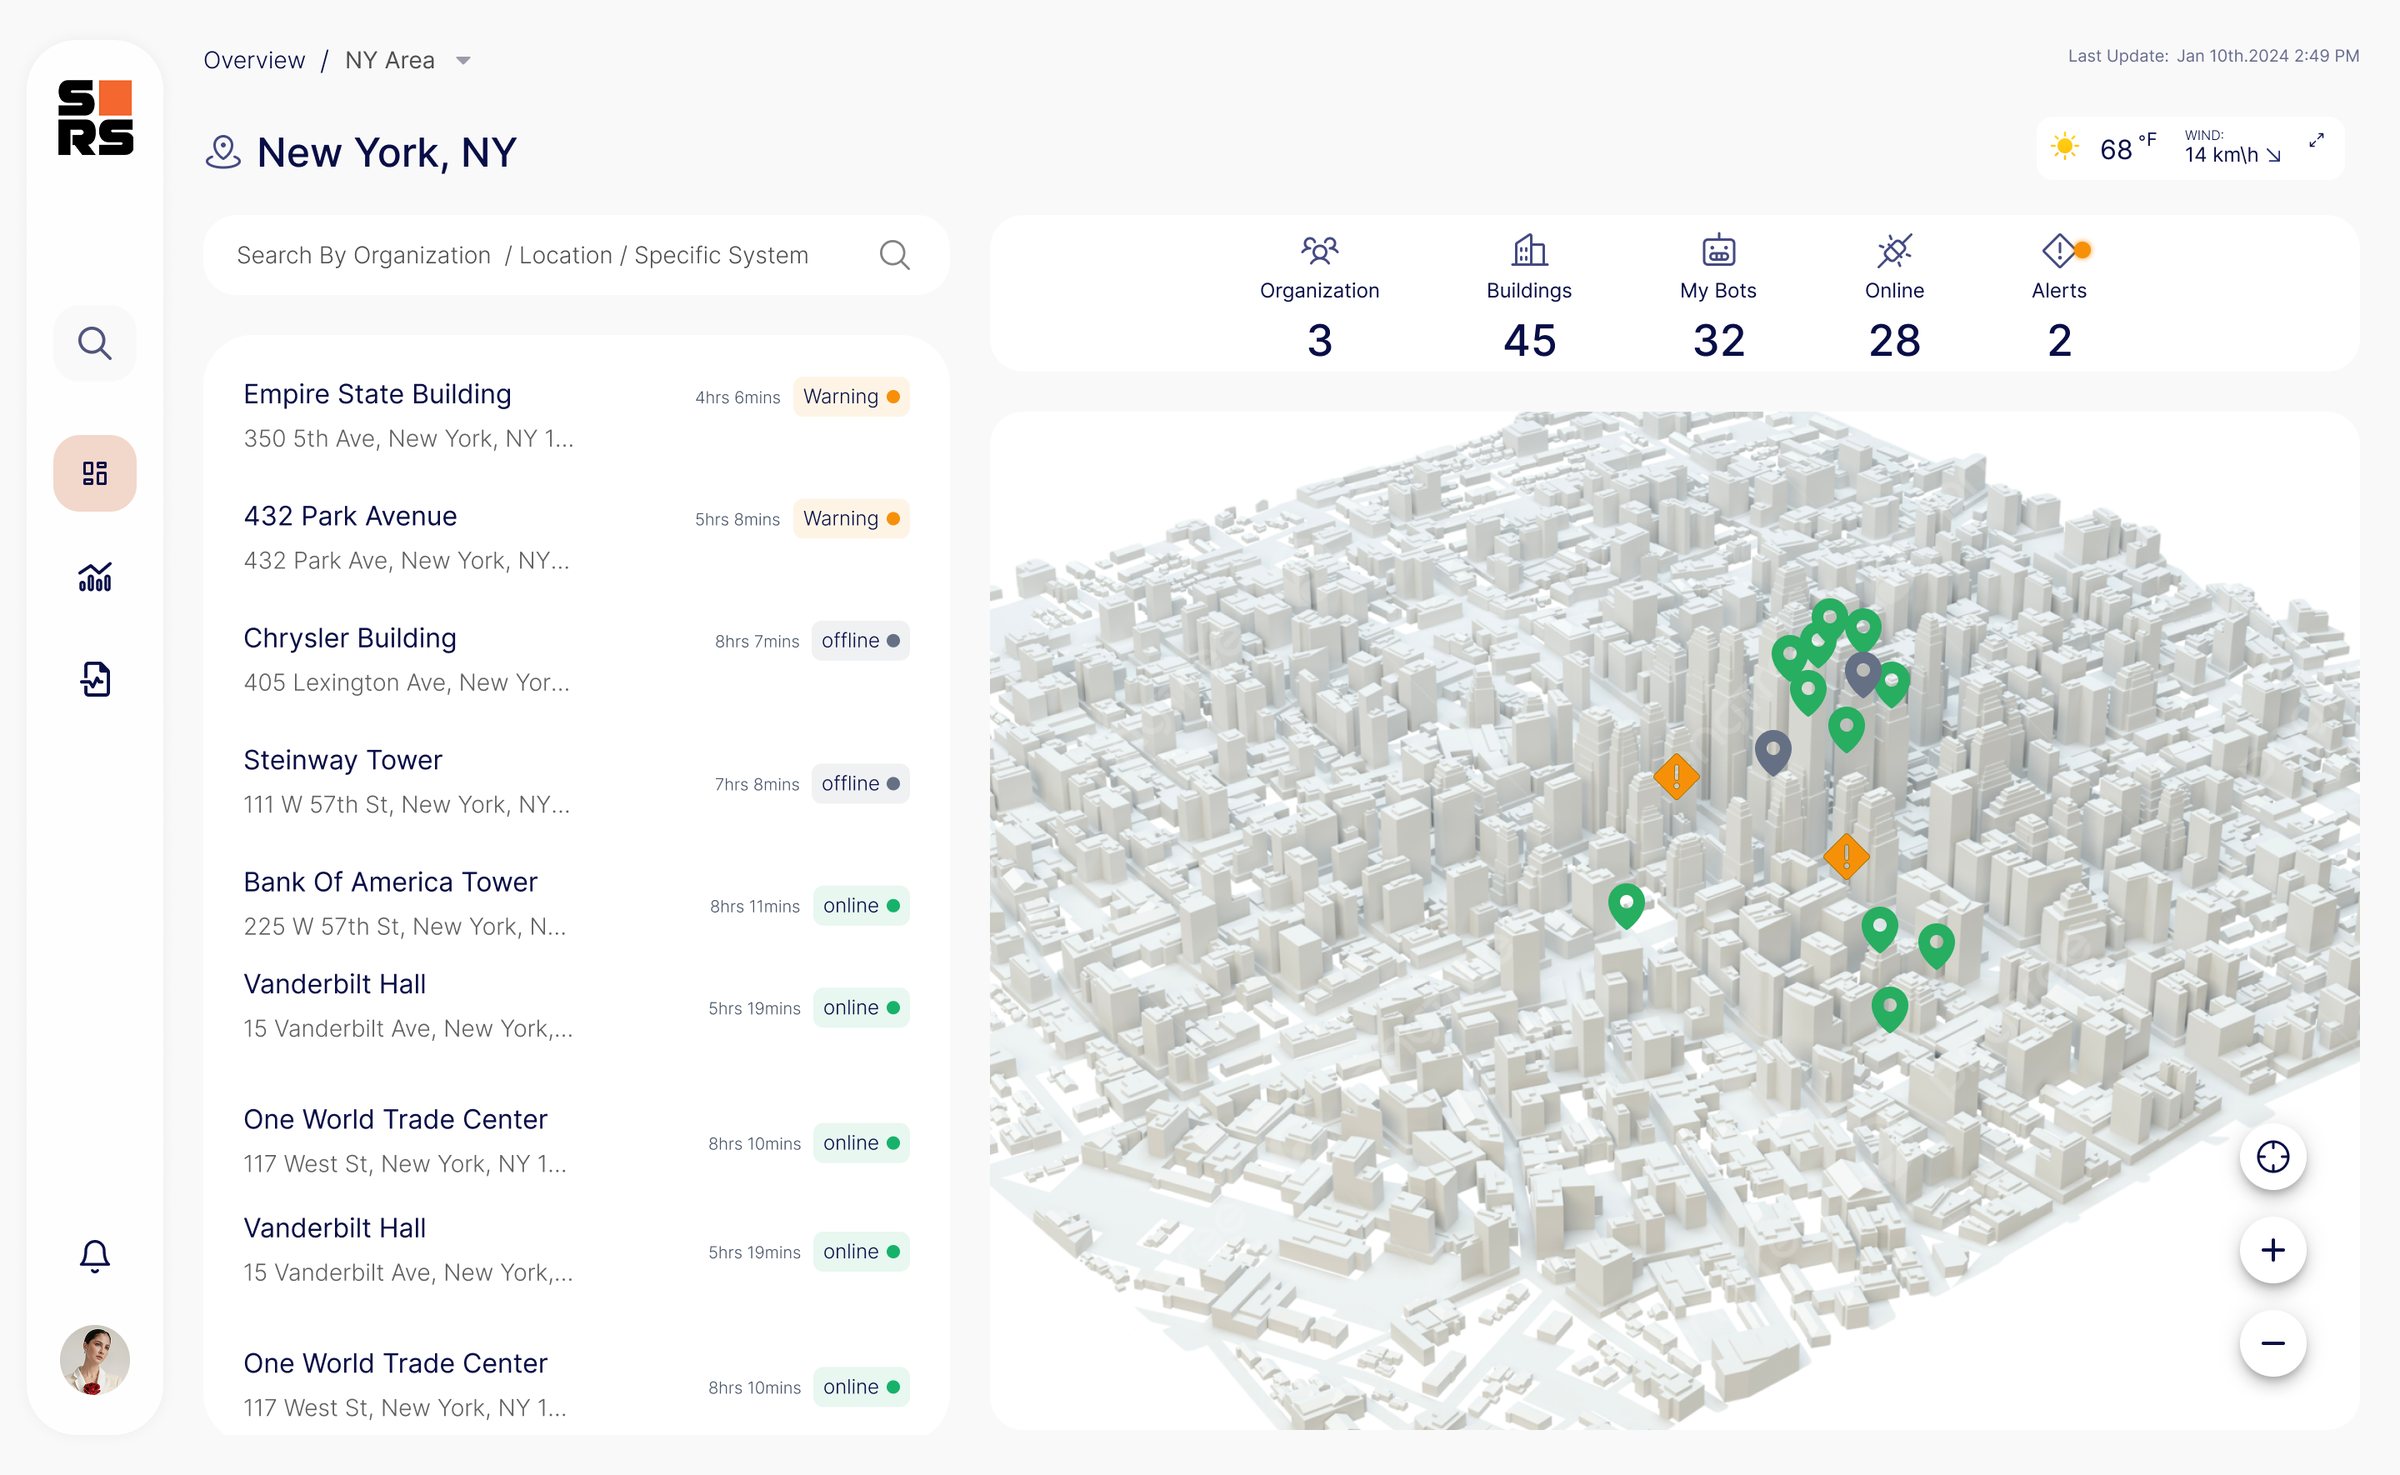
The area manager’s entry point: every building in the region with its live status, on a 3D map with weather and wind alongside.

New York region: building list with online, warning and offline states next to a 3D city map with status pins
  • Status indicators

    A color-coded building list with online, warning and issue states.

  • Weather widget

    Temperature, wind speed and operational safety thresholds, right next to the buildings.

Level 3 · Building detail

Building Deep-Dive

Window-by-window progress for a single building, with facade switching and a cleaning log that records every cycle, including weather stops.

Single building view: cleaning log with a heavy-winds stop and a window grid of the north facade
  • Historic cycles

    Past cleaning cycles and their completion, for performance tracking.

  • Facade switching

    North, south, east and west facades, to follow work on every side.

  • Window grid

    The facade as a grid, with the live cleaning status of every window.

Building setup

Building Onboarding

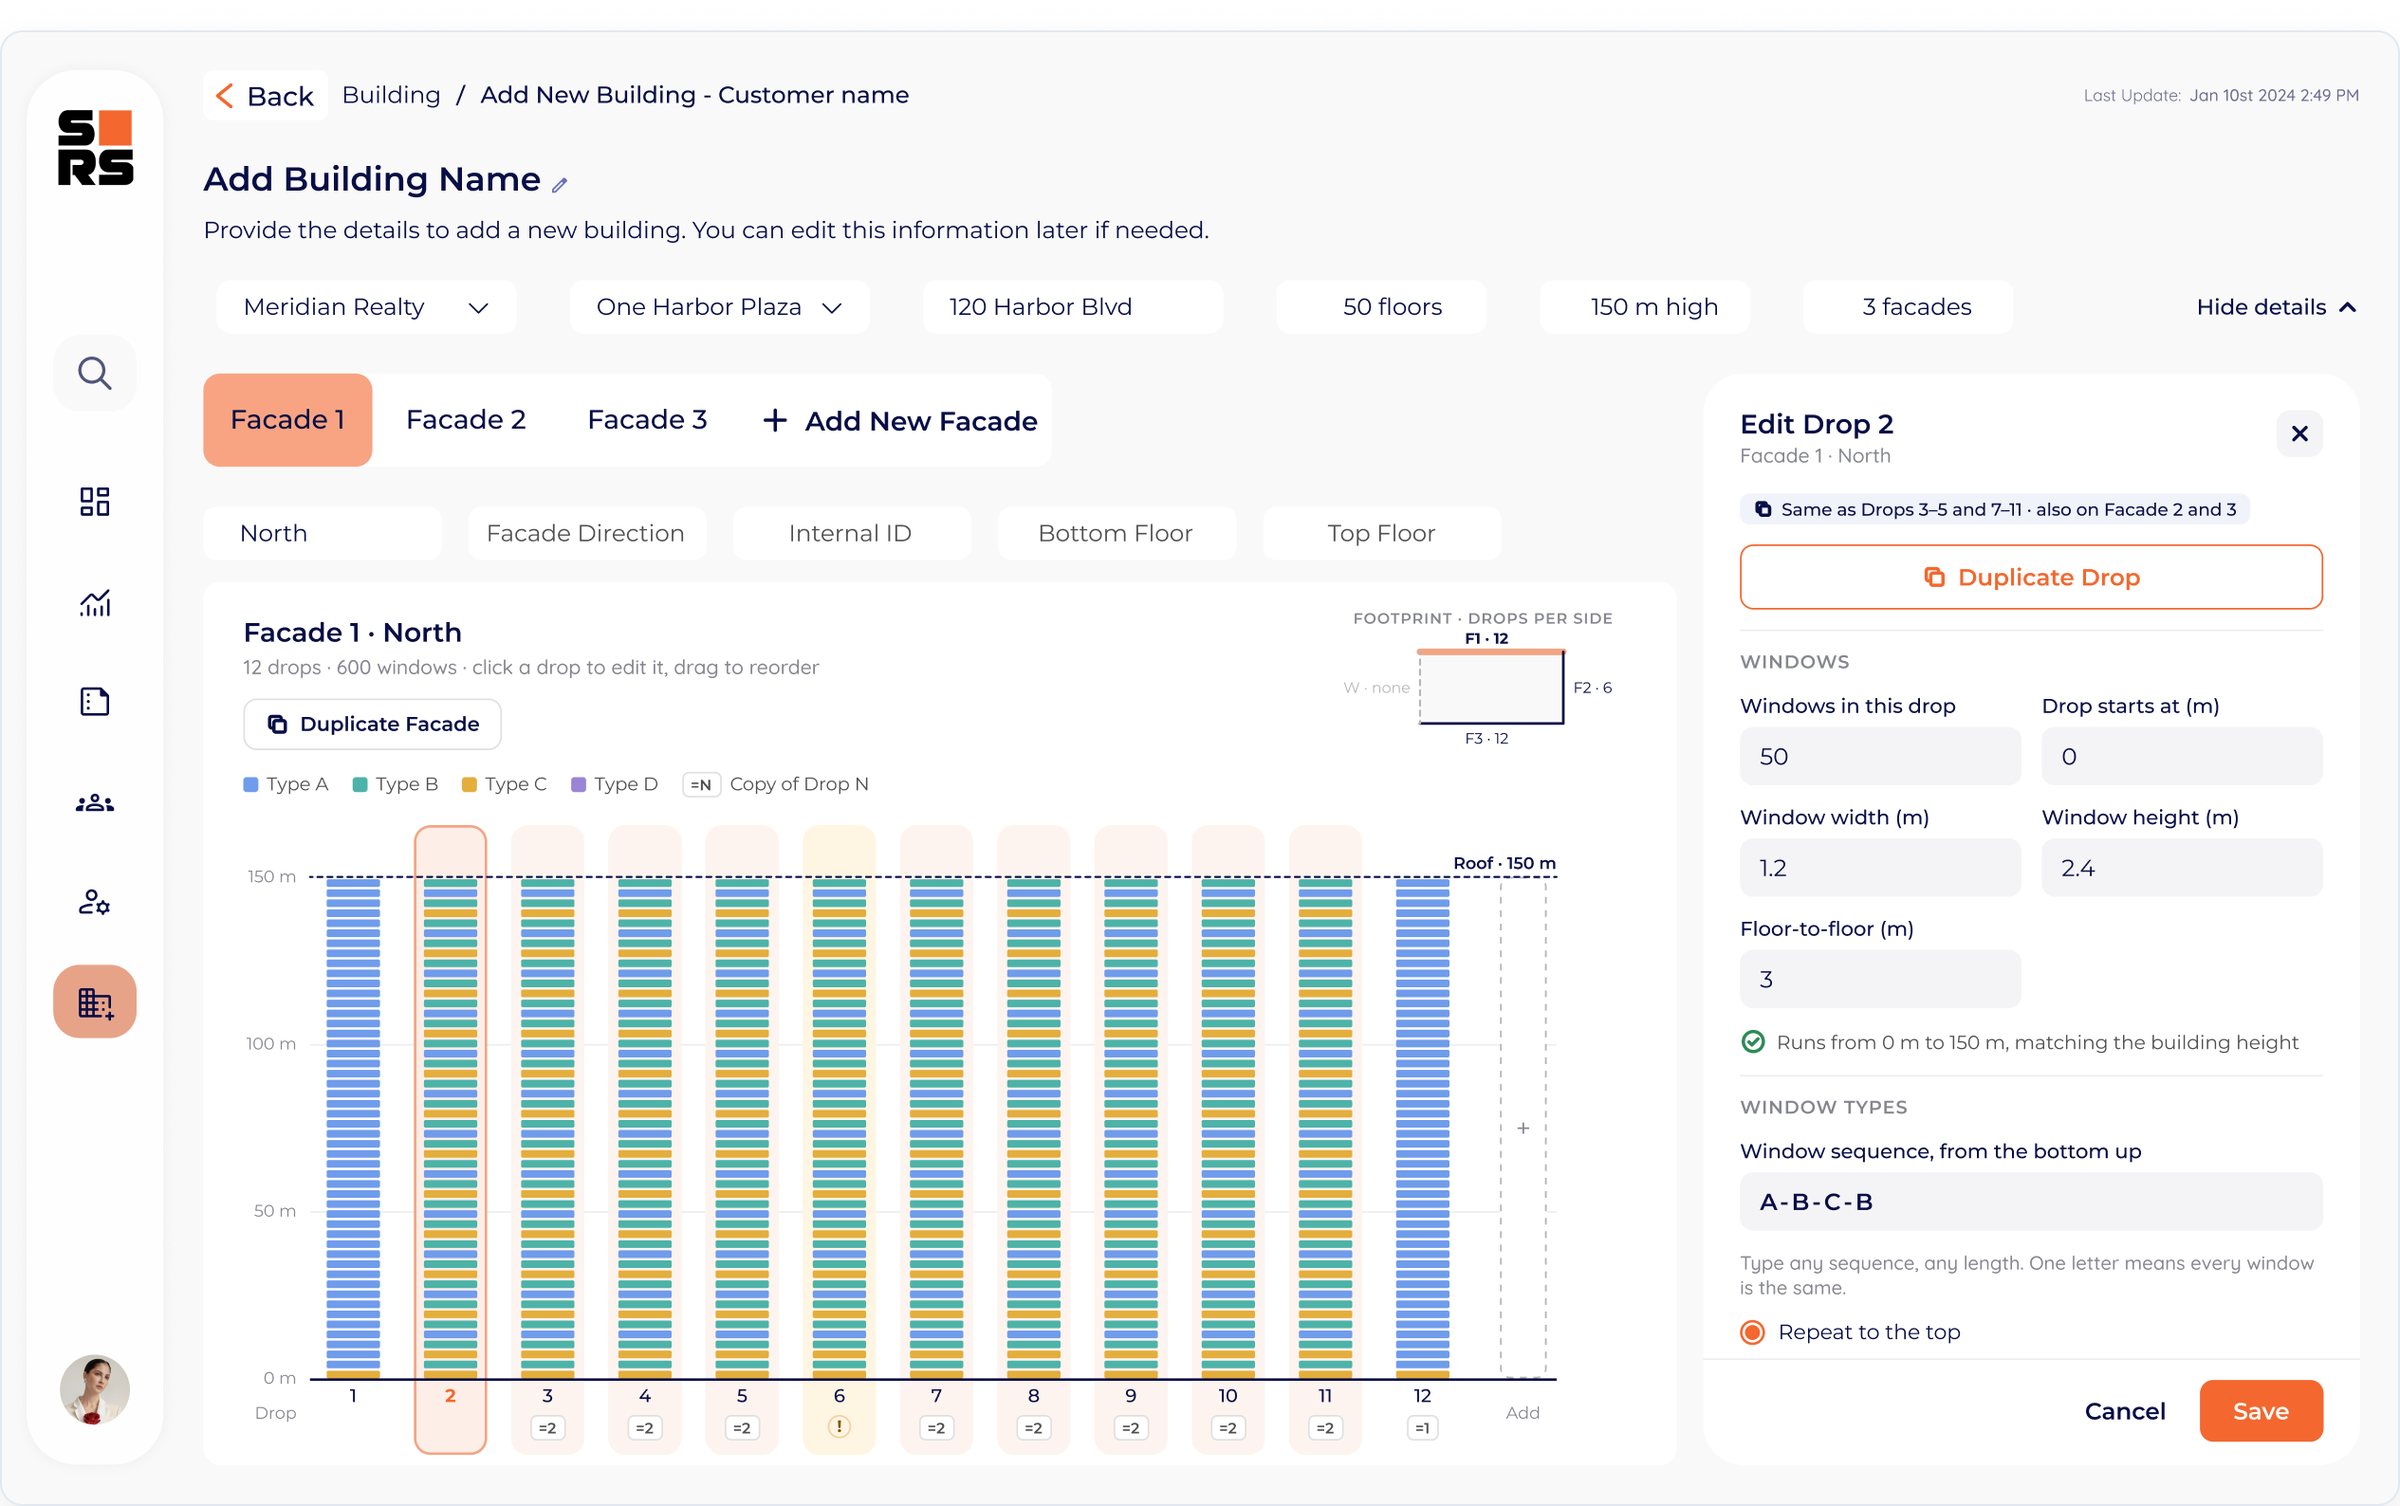
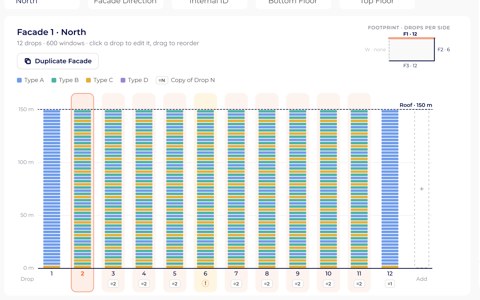
Every window in the view above has to be mapped before a robot can start. I designed the screen where the operator enters it on-site, with no developer in between: one drop, duplicated across the facade, with soft checks that catch typos before they reach the robot.

Add New Building screen with a facade schematic of twelve drops and an Edit Drop panel
Building Onboarding · Read the full case study

Level 4 · Management

Granular analytics and anomaly detection

Operational KPIs for a single building, compared against historical averages to surface anomalies.

Building analytics: savings and hours-saved cards, completed drops, and resource use compared with historical averages

Figures shown are sample data.

  • Business value

    Estimated annual savings and operational hours saved, compared with traditional cleaning.

  • Benchmarking

    Current resource use against historical averages, to spot spikes early.

  • Progress tracking

    Completed drops against the plan, with daily averages.

Level 4 · Reports

Operational analytics

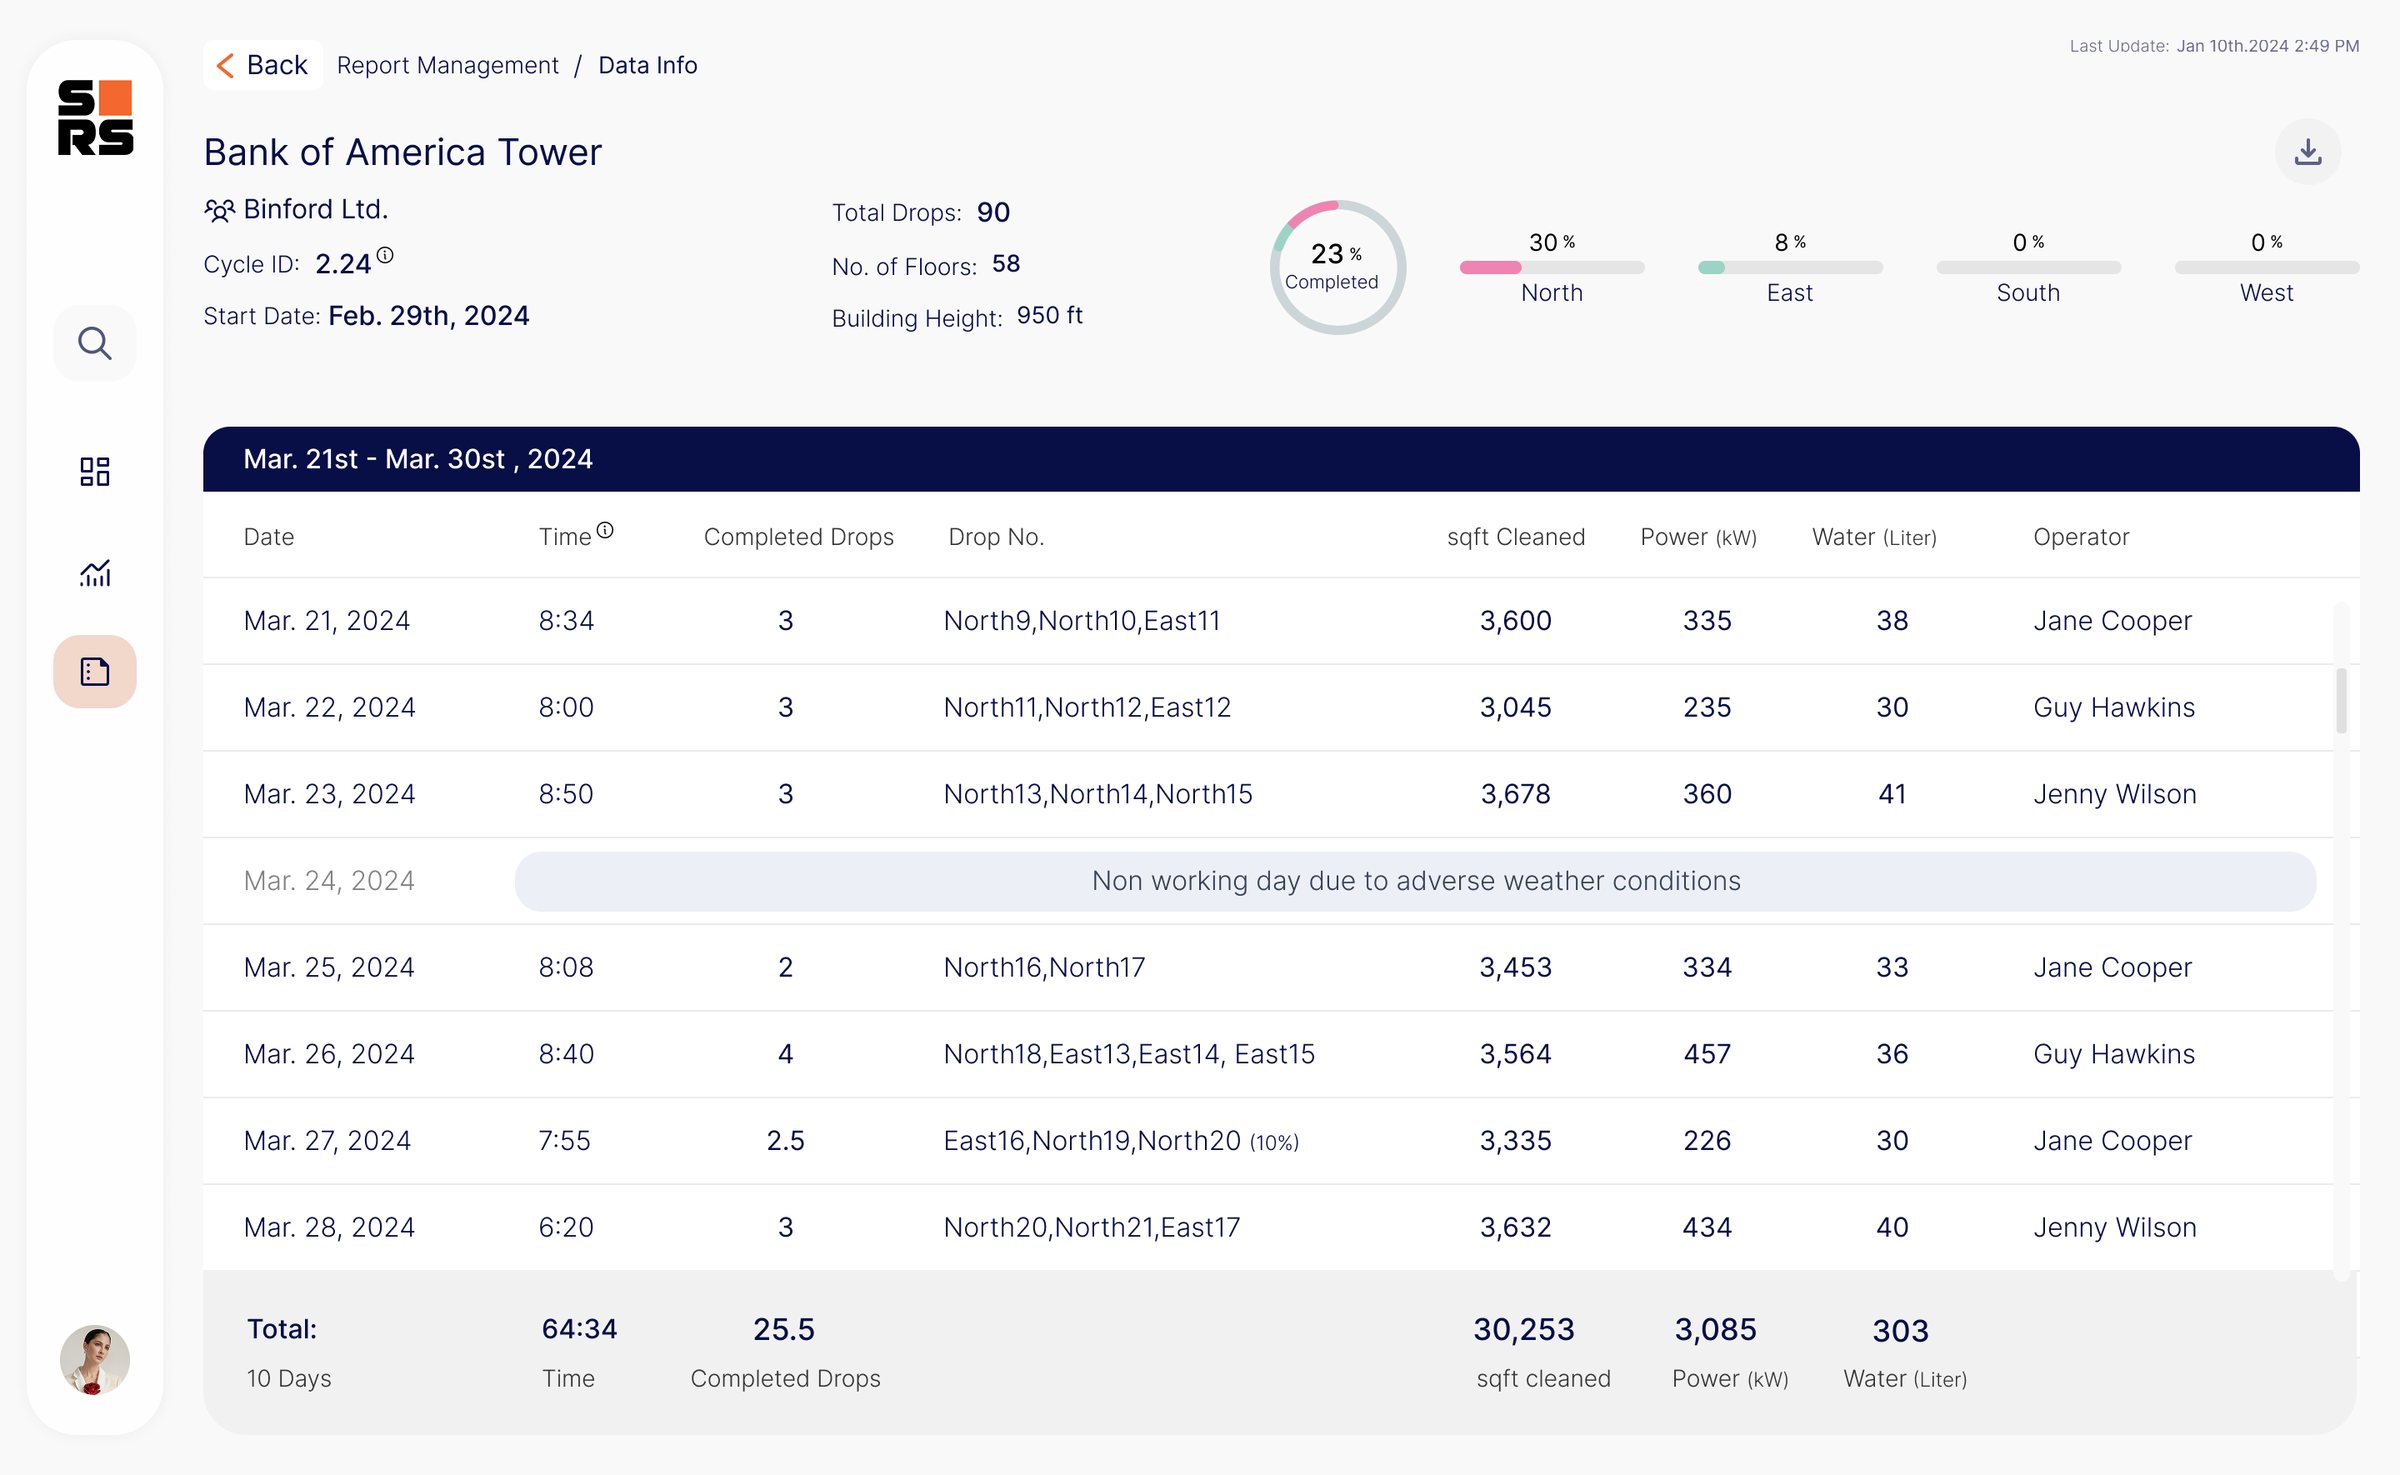
Performance scores, completed drops and water consumption per building, for client and sustainability reporting.

Report view with performance scores, completed drops and water consumption per building

Figures shown are sample data.

  • Performance scores

    Actual against expected performance, per building.

  • Completed drops

    Historical data on completed operations.

  • Water consumption

    Usage per day, with anomaly alerts for unusual use.

Results

Impact and outcomes

  • Self-serve insights

    Self-serve

    Customers could check fleet and building status themselves, without asking the engineering team.

  • Support load

    Fewer requests

    Routine “what’s happening with the robot?” questions moved from engineering to the dashboard.

  • Shared view

    One platform

    Owners and area managers worked from the same live data, each starting at their own level.

Key learnings

  • Visibility first

    Prioritizing “what is happening now” over historical analysis was the key to adoption.

  • Operational context

    Putting weather and wind data on the map let managers decide on weather stops without switching tools.

  • Dual persona design

    Serving both operational detail (area managers) and an executive overview (company owners) needed a flexible drill-down architecture.

  • System standardization

    A modular design system let the platform grow its data architecture even while the product was in rapid MVP stages.

Also at Skyline RoboticsBuilding OnboardingOperators map new buildings into the system themselvesView case study

Let’s talk

Open to product design roles in B2B and complex systems. Happy to talk.