
Stealth
Development Intelligence Platform
B2B analytics for R&D leaders
An early-stage startup building a development-intelligence platform. It unifies data from Git, project management and GenAI tools to show R&D leaders how their teams build software, and what it costs.
I was the only designer, working with three engineers and early customers. I defined and designed new features based on what customers needed to see, and redesigned a product that until then had been designed by the engineers themselves.
- Competitive analysis
- Solo designer
- Dev tools
- B2B
- SaaS
- Role
- Freelance Product Designer (on-site)
- Timeline
- 2023
- Team
- 1 Designer, 3 Engineers
- Platform
- SaaS Platform
The challenge
Critical data is scattered across tools, with no single source of truth
Leaders can’t clearly understand productivity, AI impact, or how resources map to business goals.
Pain points
- Data is fragmented across multiple tools with no unified view.
- There is no clear way to measure the impact of GenAI on productivity or quality.
- Engineering effort is not translated into cost, ROI or business value.
- Leaders are expected to make decisions without reliable, consistent data.
The solution
One analytics layer for all the data, with a view for each stakeholder
It delivers GenAI ROI, productivity, quality and cost insights to support real decision-making.
Key features
- Unifies data from Git, project tools, GenAI and HR into a single analytics layer.
- Quantifies the impact of GenAI on productivity, quality and development speed.
- Combines code and process metrics to reveal trends in performance and quality.
- Translates engineering activity into time, cost and ROI insights tied to business goals.
Who it’s for
Two leaders, two different questions
Both look at the same data, but at a different altitude. That’s why the platform opens on an organization-wide view and lets each user drill down to a team or a single developer.
VP R&D
Runs a large R&D organization across several regions, and answers to the C-level.
“Is our engineering budget going to the right places?”
Needs to
- Manage budget and operational efficiency
- Report team performance to the C-level
- Spot risks, delays and inefficiencies early
Answered by: Jira Spend, GenAI impact in Activity
Engineering manager
Leads a team of 12–15 engineers, and needs to show its impact to leadership.
“Where is my team stuck, and how do I prove what we deliver?”
Needs to
- Track individual and team productivity
- Find bottlenecks in the development workflow
- Justify resource allocation decisions
Answered by: Activity, Developer profile
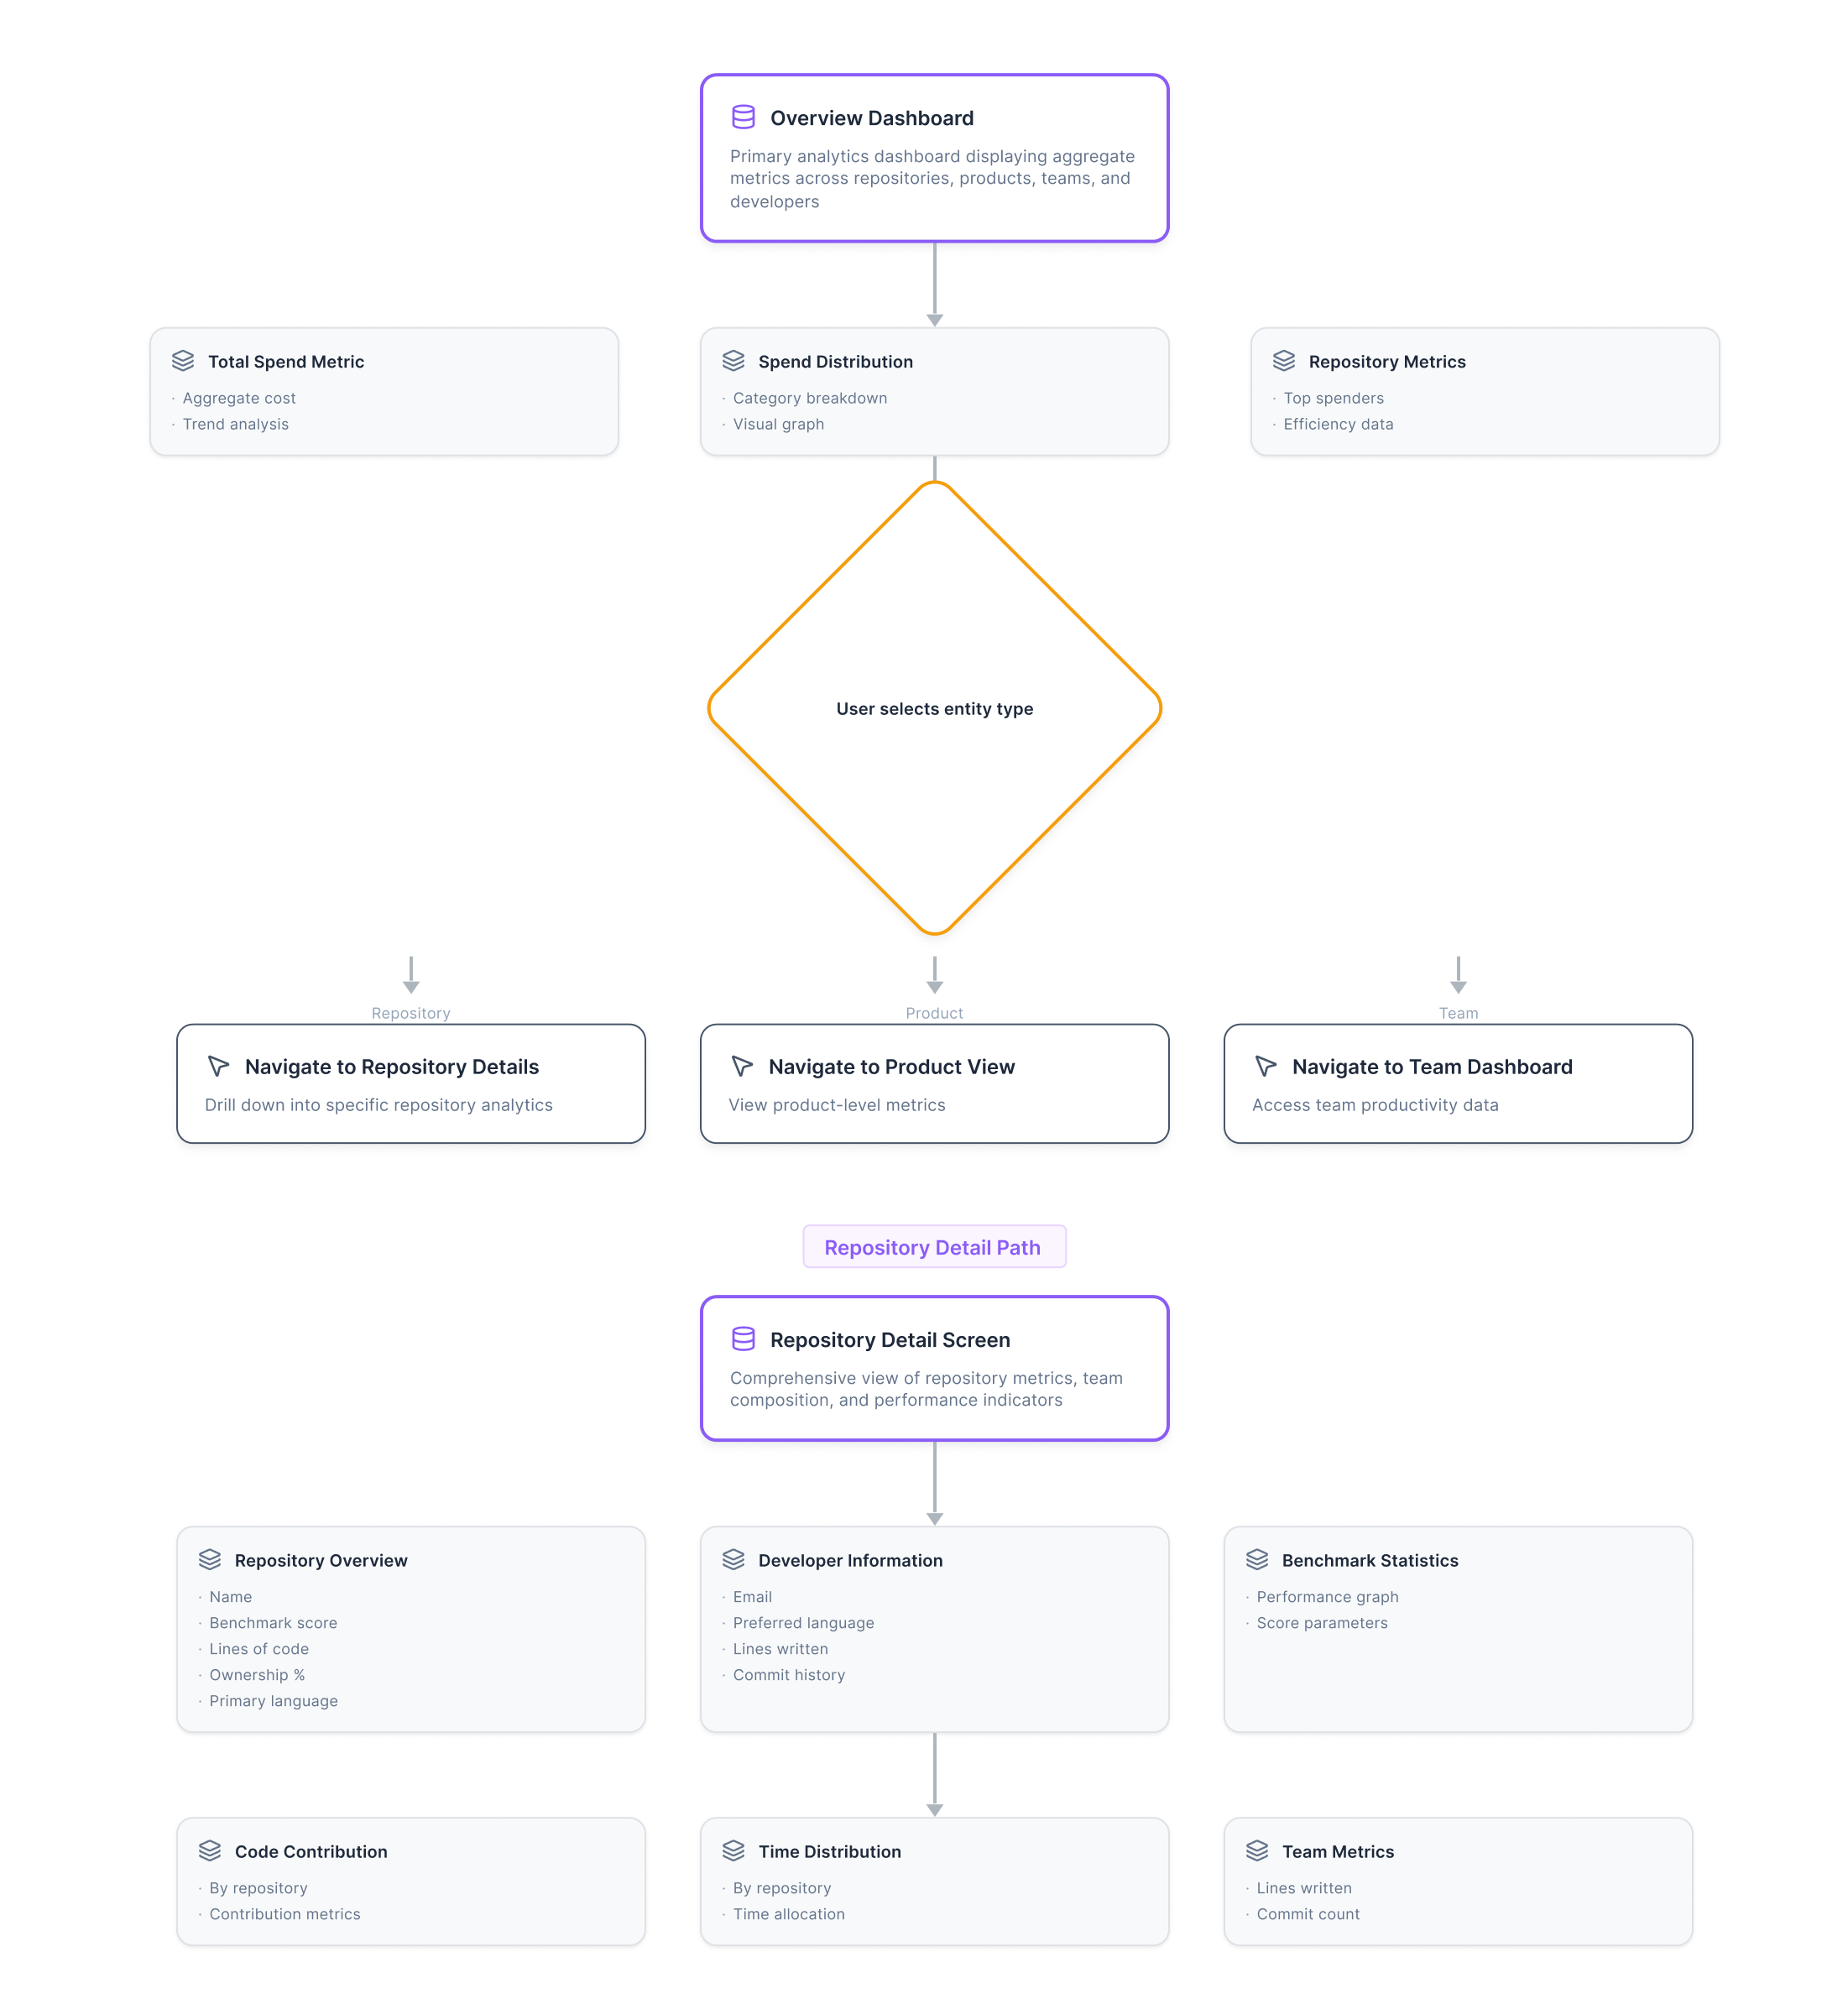
Information architecture
Defining system flows
I mapped the user journey to find the key pain points and opportunities across the experience.
1Entry point
Overview Dashboard
2Entity selection
Repository, product or team
3Detail view
Entity-specific analytics
4Integration
Issue tracking
Research and insights
Competitive analysis
Out of five competitors I analyzed in depth, I’m highlighting three here, with their main features, strengths and limitations. It’s a snapshot of the full research that guided my design decisions.
Competitor 1
- Key features
- Cycle time metrics, Automation bot, Slack integration
- Strength
- Intuitive, easy-to-use interface
- Limitation
- No cost or ROI insights
Lacks financial reporting
Competitor 2
- Key features
- Code-level reporting, PR and commit analytics, Benchmarking
- Strength
- Detailed insights into code
- Limitation
- Limited team performance breakdowns
Less focused on team leaders
Competitor 3
- Key features
- Engineering dashboards, Correlates DevOps data, Review workflow metrics
- Strength
- Comprehensive set of reports
- Limitation
- No deep dive into GenAI impact
Focuses on DevOps practices
- Insight 01
Most tools don’t talk money
Added financial indicators to every chart
- Quarterly savings comparisons
- Tooltips translating % to $
- Direct links to Jira cost items
- Insight 02
There’s data, but no depth
Built drill-down into every widget
- Navigation from group → team → individual
- Filtering by repo, quarter or GenAI tool
- Quick access to team-specific insights
- Insight 03
GenAI is present but not measured
Designed a dedicated GenAI impact dashboard
- KPIs comparing AI vs. non-AI contributions
- Time saved per pull request
- Usage trends by group and quarter
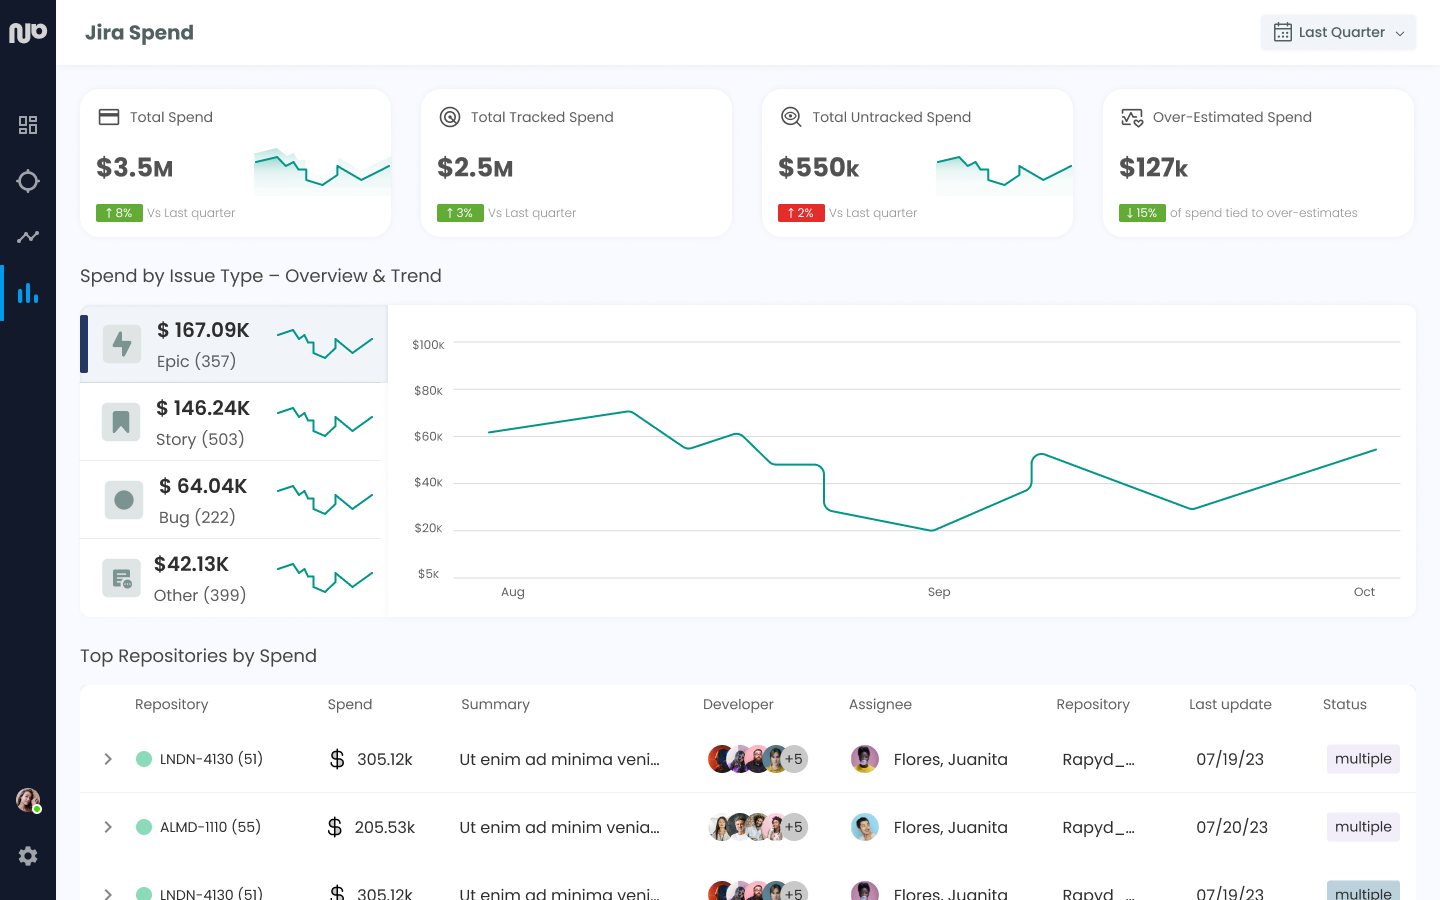
Screen 1 of 5
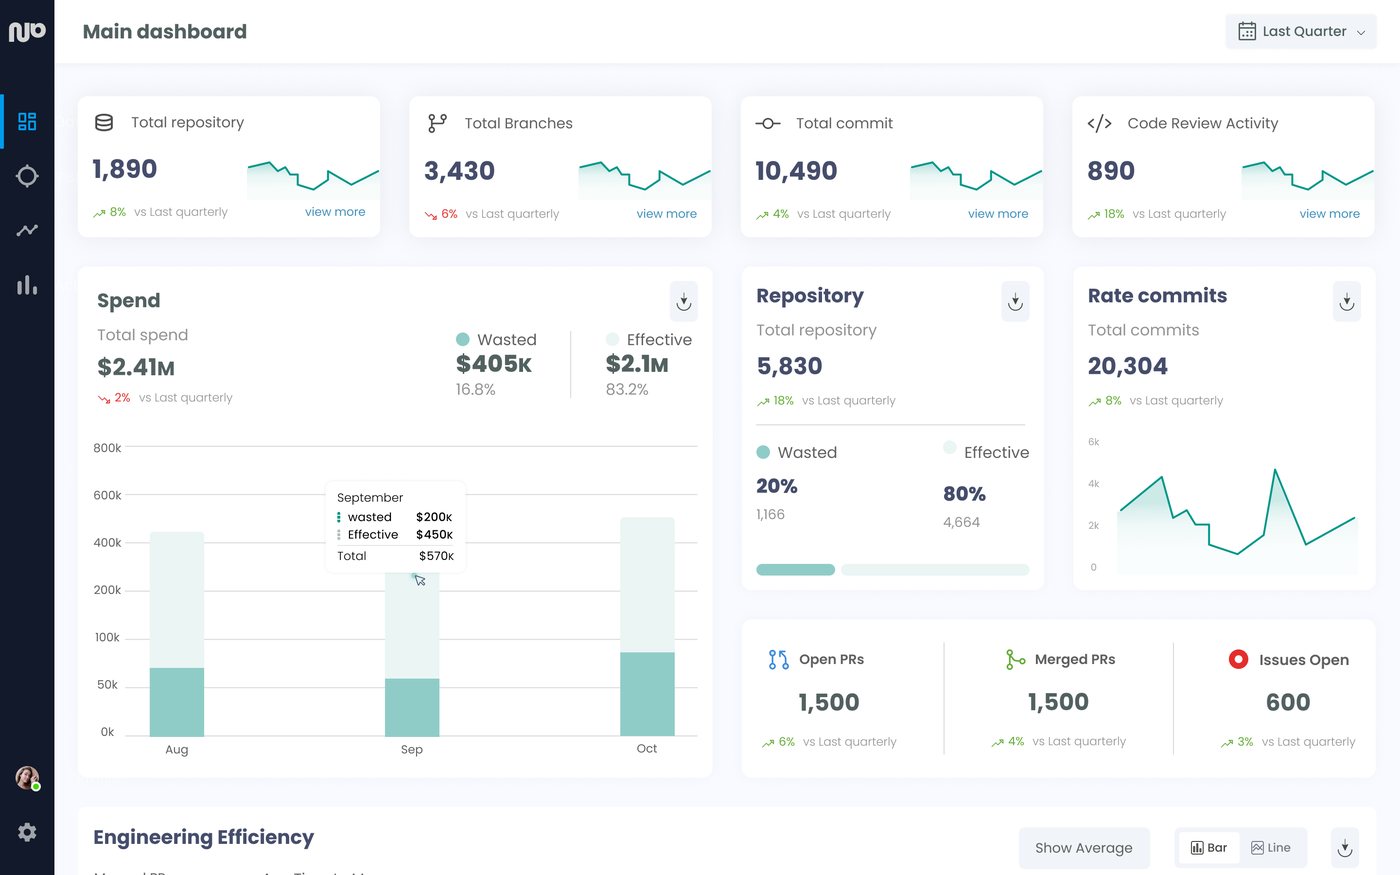
Jira Spend
Engineering effort translated into dollars, by issue type and repository, so leaders can see what development actually costs. Figures shown are sample data.
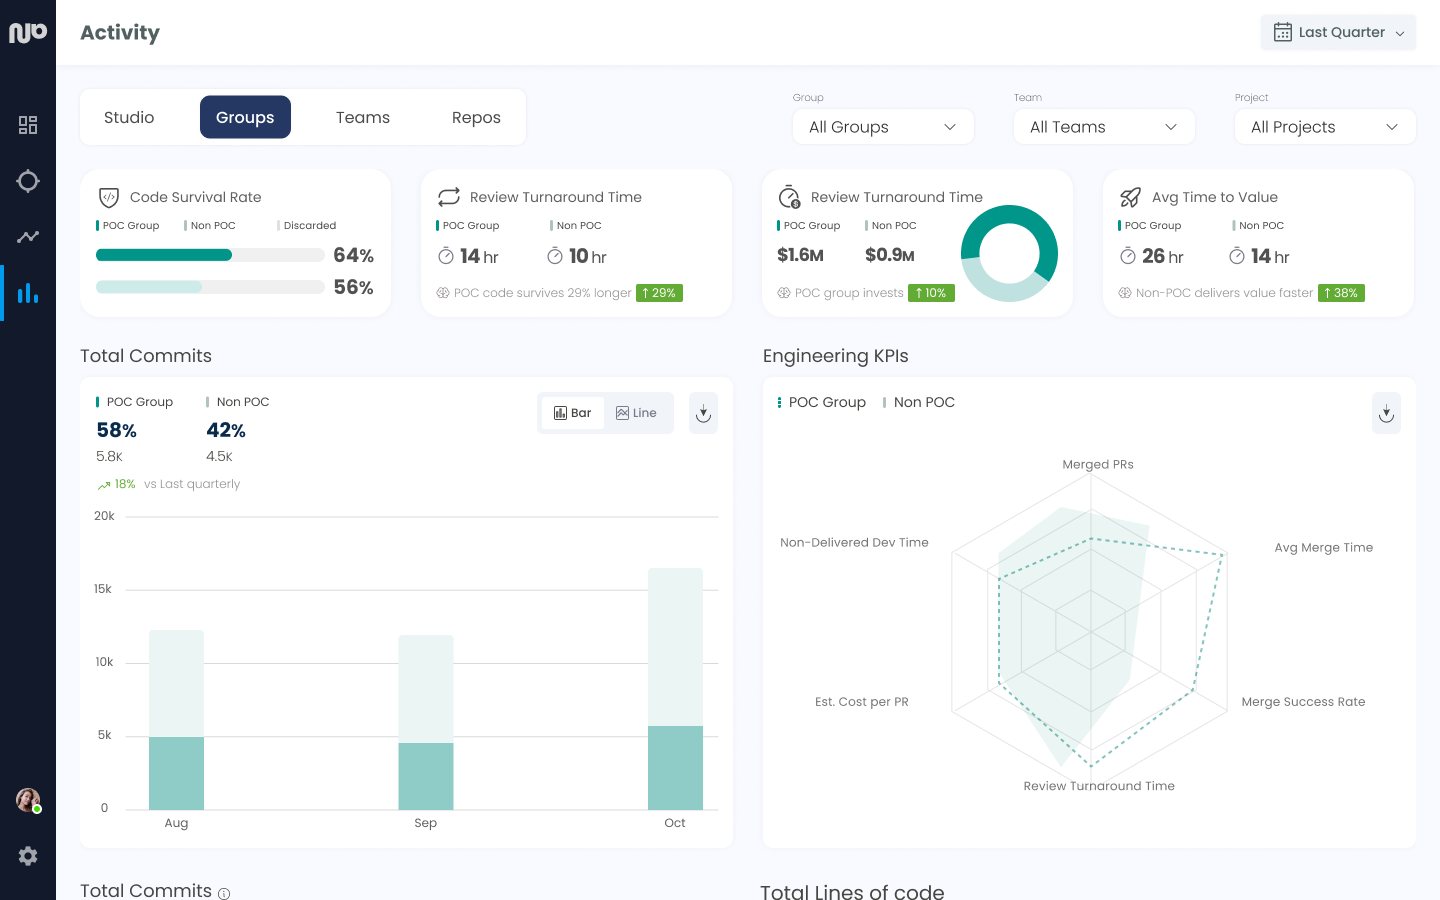
Screen 2 of 5
Activity
Teams using GenAI tools (the POC group) compared with the rest, across groups, teams and repositories. Figures shown are sample data.
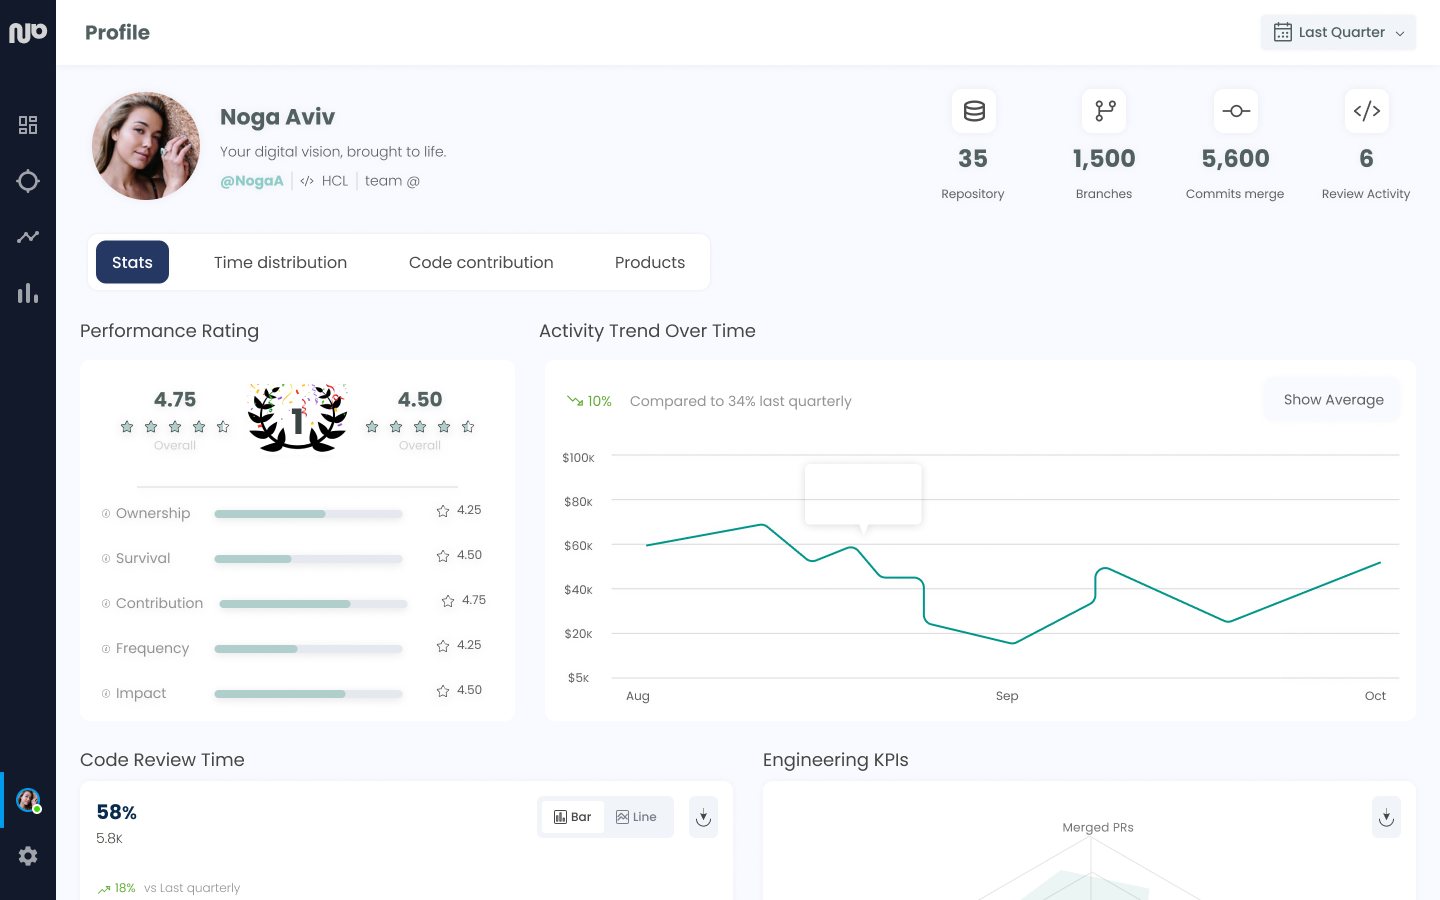
Screen 3 of 5
Developer profile
The deepest level of the drill-down: each developer’s contributions, review activity and trends. Figures shown are sample data.
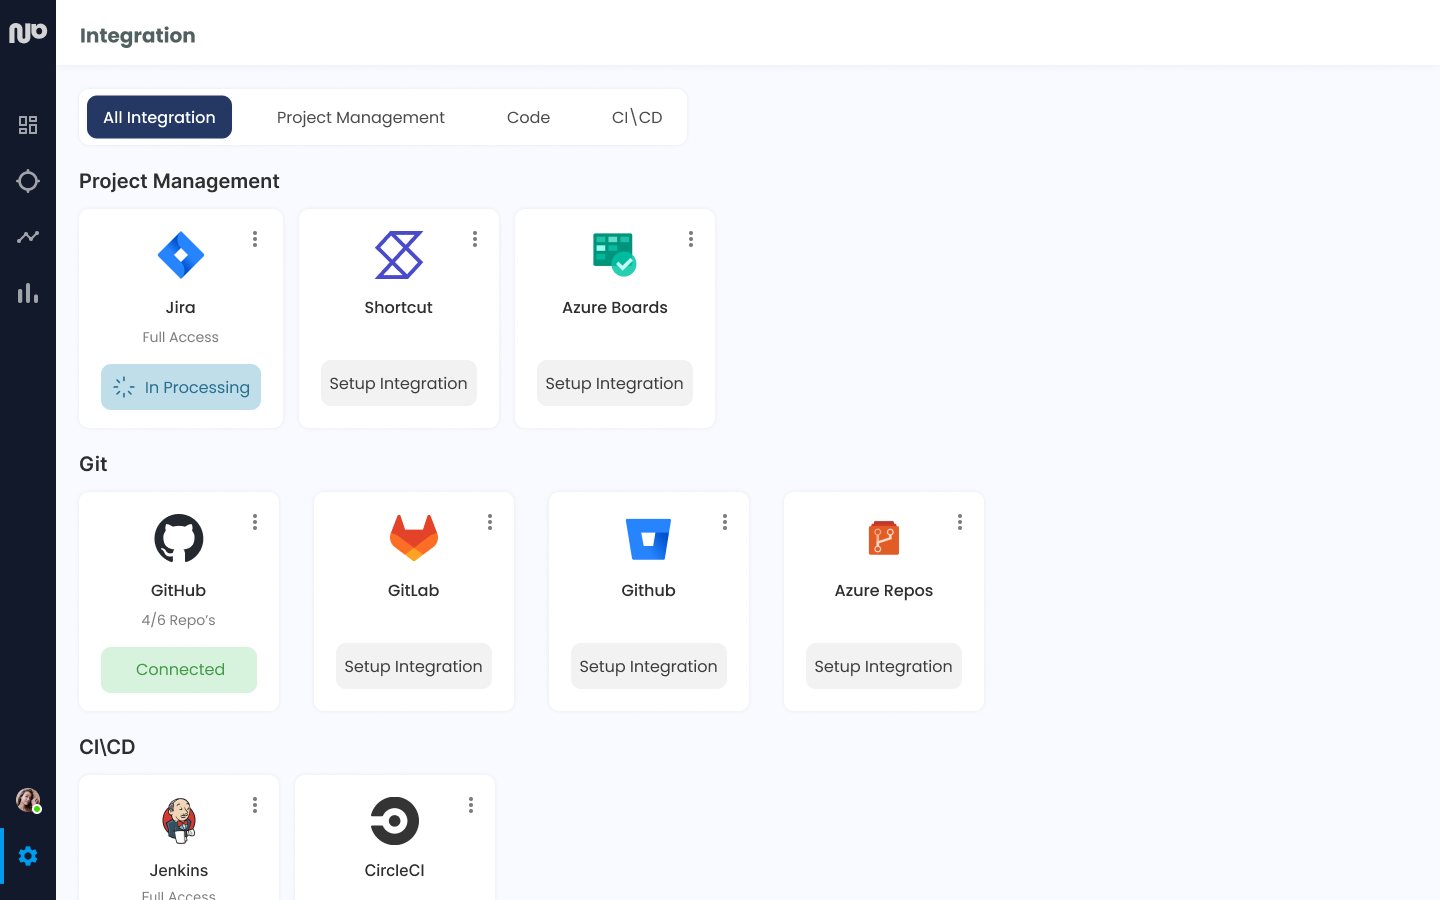
Screen 4 of 5
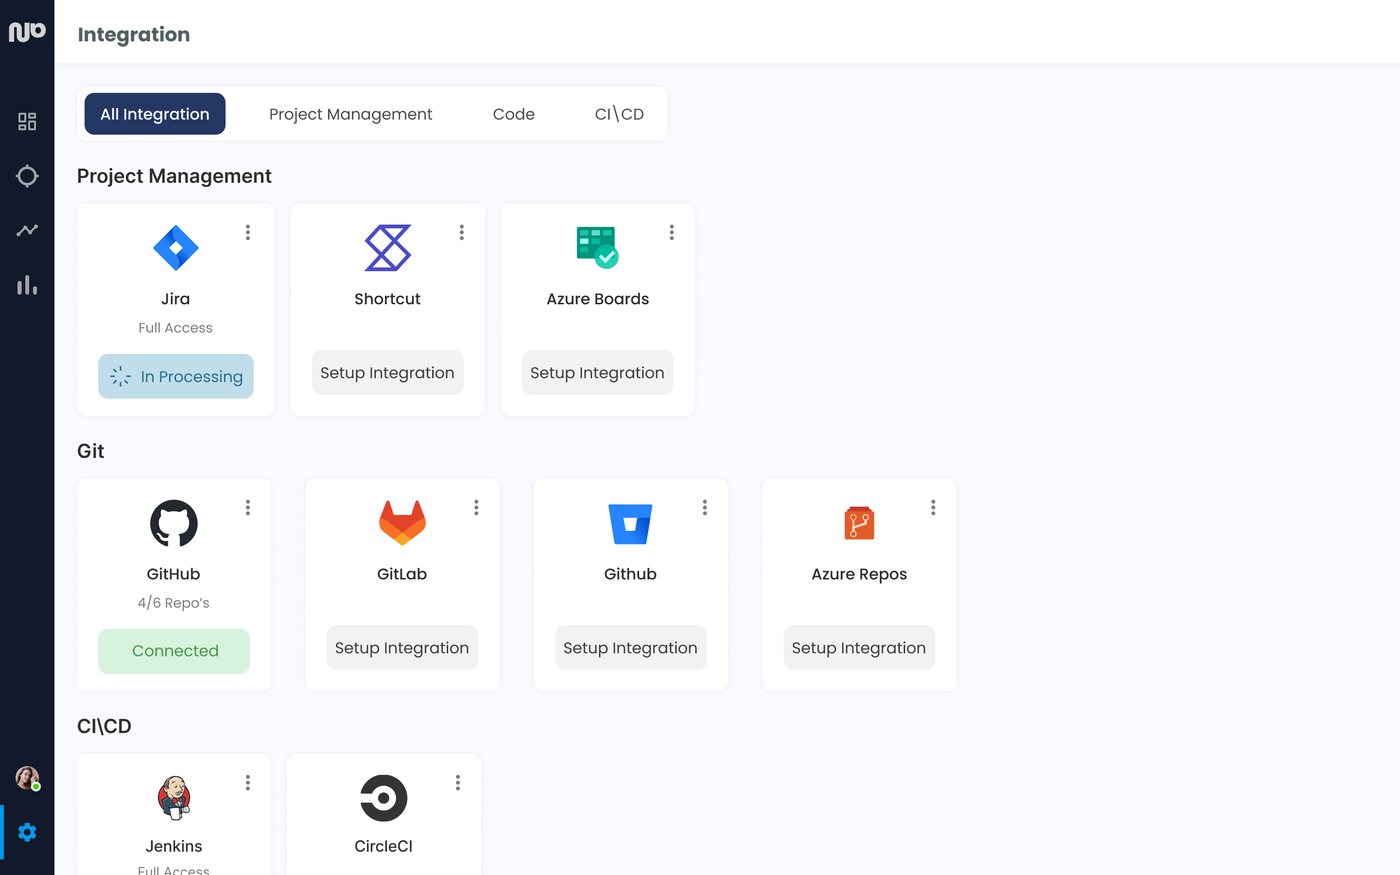
Integrations
Connecting the tools the data comes from: project management, Git and CI/CD.
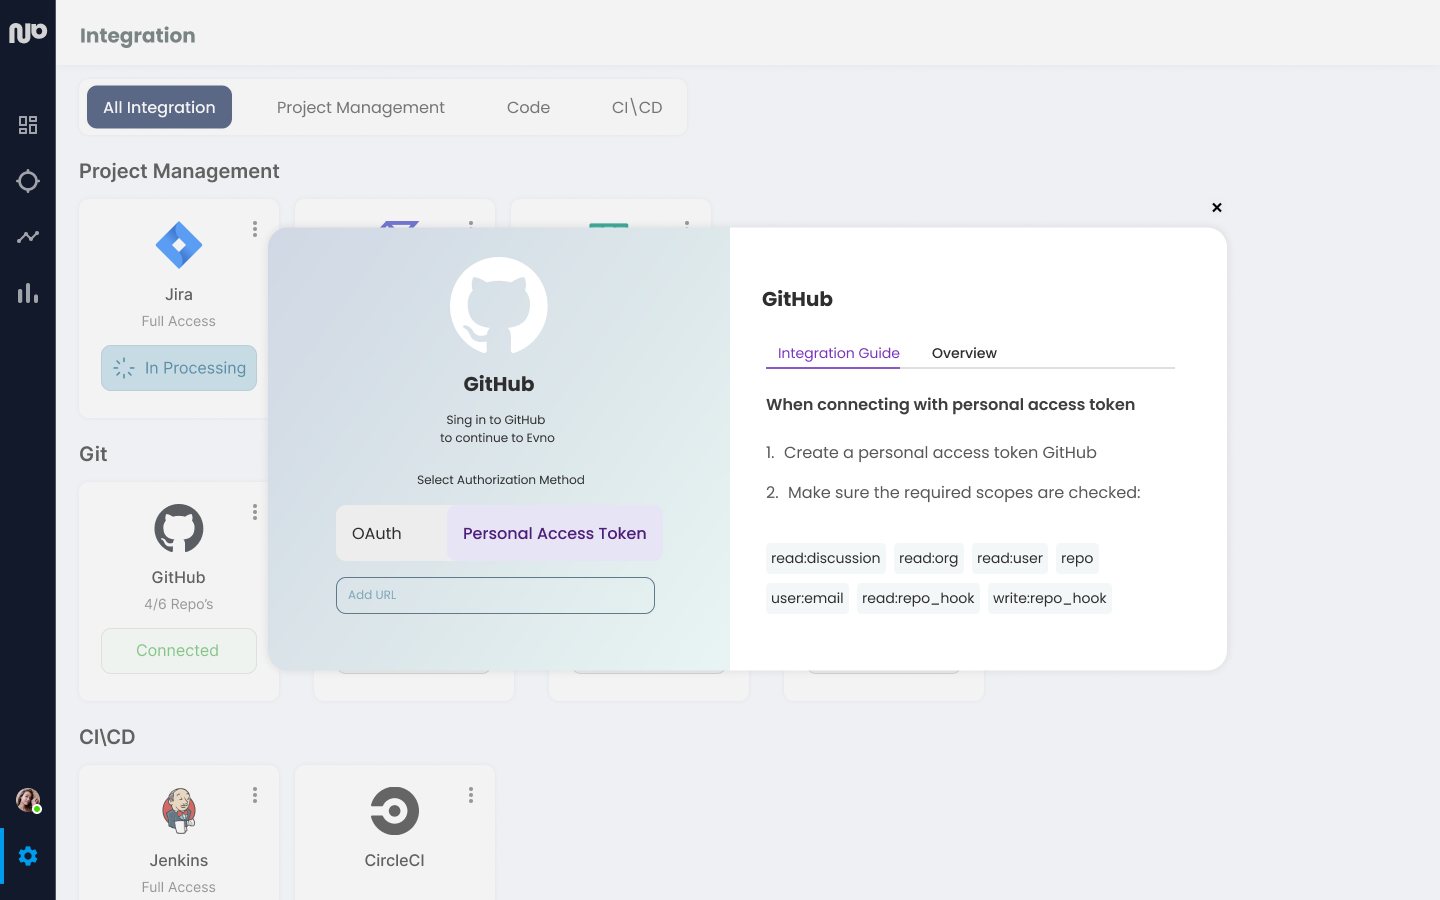
Screen 5 of 5
Connecting GitHub
A guided setup for each integration, with OAuth and personal access token options.
Outcome
Shipped to early customers
The screens shipped to early customers, who used them and gave feedback.
Trade-off
With the product still being validated, we prioritized speed over a formal design system.